Transportation of hazardous materials at lowest level since 2015
| Jaar | Domestic transport (million tonnes) | Imported (million tonnes) | Exported (million tonnes) | In transit (million tonnes) |
|---|---|---|---|---|
| 2015 | 251.7 | 229.0 | 196.6 | 12.7 |
| 2016 | 254.2 | 233.5 | 207.4 | 14.2 |
| 2017 | 249.0 | 244.7 | 214.8 | 14.8 |
| 2018 | 234.5 | 244.5 | 211.8 | 14.5 |
| 2019 | 241.2 | 245.7 | 208.2 | 15.6 |
| 2020 | 212.9 | 239.8 | 192.0 | 14.5 |
| 2021 | 218.0 | 244.7 | 203.1 | 14.9 |
| 2022 | 199.7 | 264.7 | 204.4 | 13.2 |
| 2023 | 194.3 | 251.3 | 198.1 | 14.1 |
Hazardous materials include all substances and products that pose a potential hazard to human health, animal health and the environment, even in small quantities, due to their specific properties. These materials must be transported according to European agreements and regulations.
In 2023, 36.9 percent of all freight transported in the Netherlands (by weight) consisted of hazardous materials. The majority of these (by weight) were gases and flammable liquids, such as oil and gasoline. Other examples of hazardous materials include fireworks, products used in perfumes, ammonia and lithium-ion batteries.
Transportation of gases continues to fall
In 2023, 146 million tonnes of hazardous gases were transported within the Netherlands. That was less than in 2021 and 2022, when the quantity of gases transported (by weight) actually increased. Domestic transport within the Netherlands and exports fell, in particular. The drop in domestic transportation was mainly due to the drop in natural gas extraction in the Netherlands. Gas production in the Groningen gas field ended permanently on 1 October 2024.
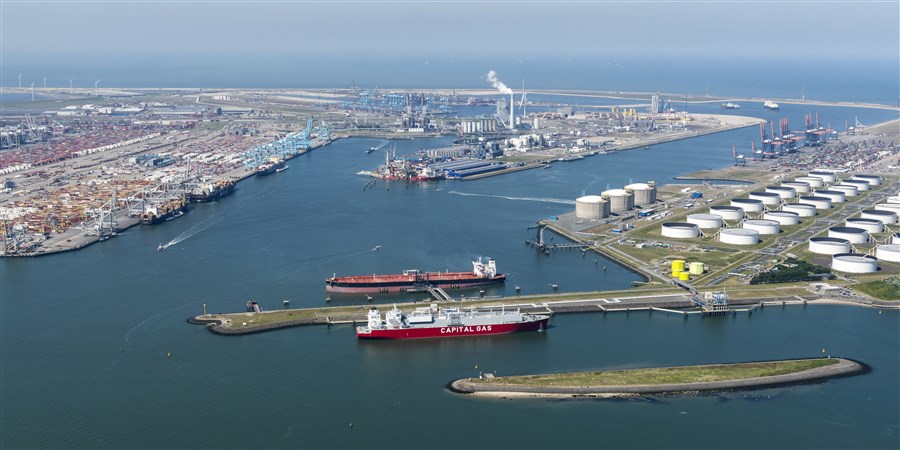
Imports of gases have actually increased in recent years: over 31 million tonnes were imported in 2015, compared to over 59 million tonnes in 2022 and over 54 million tonnes in 2023. Most of this increase was due to imports of LNG (liquefied natural gas) by tanker. Following Russia’s invasion of Ukraine, alternatives to Russian gas were found to reduce the Netherlands’ dependence on Russian gas, which had mainly arrived in the Netherlands by pipeline. In 2022, an extra LNG terminal was opened at Eemshaven, further facilitating the import of gas by tanker from outside Europe.
| Jaar | Hazardous materials (all) (million tonnes) | Flammable liquids (million tonnes) | Gases (million tonnes) | Other (million tonnes) |
|---|---|---|---|---|
| 2015 | 690.1 | 438.7 | 198.5 | 52.9 |
| 2016 | 709.3 | 449.0 | 203.8 | 56.5 |
| 2017 | 723.3 | 455.1 | 196.1 | 72.1 |
| 2018 | 705.3 | 440.7 | 194.6 | 70.0 |
| 2019 | 710.8 | 461.8 | 180.9 | 68.1 |
| 2020 | 659.3 | 433.1 | 159.4 | 66.8 |
| 2021 | 680.7 | 451.9 | 160.5 | 68.3 |
| 2022 | 682.1 | 448.0 | 169.9 | 64.2 |
| 2023 | 657.8 | 449.2 | 146.3 | 62.3 |
More hazardous materials transported by ocean-going vessel
Most hazardous materials - such as oil and natural gas - are transported by pipeline. In 2023, 42.7 percent of hazardous materials were transported by pipeline, while in 2015, the share was 49.3 percent. This fall was mainly due to a lower quantity of gases being transported.
The volume of hazardous materials transported by ocean-going vessel, on the other hand, increased to more than 260 million tonnes in 2023. That was 4.5 percent less than in 2022, but still 11.2 percent more than in 2015. The increasing quantity of gases transported, in particular, meant that more hazardous materials were transported by ocean-going vessel: 39.7 percent of the total weight transported. In 2015, gases only accounted for 34.0 percent of hazardous materials transported.
In 2023, more than 97 million tonnes of hazardous substances were transported using inland vessels. Particularly when it comes to goods in transit, inland waterways dominate with a 96.1 percent share of goods in transit being transported in this manner. Road and rail play a relatively minor role in the transportation of hazardous materials: in 2023, 2.0 percent of hazardous materials (by weight) were transported by road and 0.8 percent by rail.
| Jaar | By pipeline (% of total weight transported) | By sea (% of total weight transported) | By inland waterway (% of total weight transported) | By road (% of total weight transported) | By rail (% of total weight transported) |
|---|---|---|---|---|---|
| 2015 | 49.3 | 34 | 13.7 | 2.1 | 0.9 |
| 2016 | 48.9 | 34.3 | 13.9 | 2.1 | 0.8 |
| 2017 | 47.5 | 35.8 | 13.7 | 2.2 | 0.8 |
| 2018 | 46.7 | 37.1 | 13.2 | 2.3 | 0.9 |
| 2019 | 45.9 | 37.3 | 13.9 | 2.1 | 0.8 |
| 2020 | 44 | 38.6 | 14.4 | 2.1 | 0.9 |
| 2021 | 44 | 38.3 | 14.8 | 2.1 | 0.9 |
| 2022 | 43.2 | 40 | 14 | 1.9 | 0.8 |
| 2023 | 42.7 | 39.7 | 14.8 | 2 | 0.8 |