Migrants from India are staying longer in the Netherlands
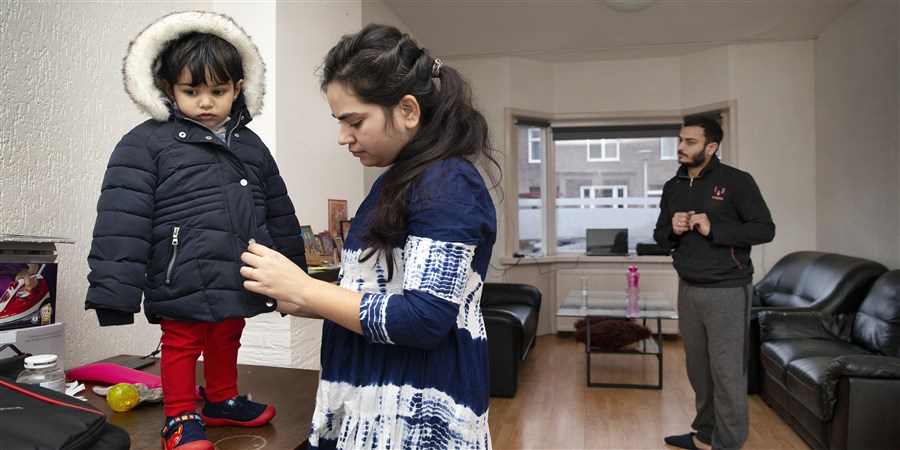
The majority of migrants from India come to the Netherlands for work or family
The vast majority of migrants from India come to the Netherlands for work, family reunification or to start a family. In 2023, 45 percent of immigrants indicated that family was their main reason for migrating, while 40 percent came here for work and 15 percent came to study. In 2013, there were more labour migrants (49 percent) than family migrants (37 percent). Indian labour migrants are often knowledge migrants and frequently work in the IT sector.| Labour (%) | Family (%) | Asylum (%) | Study (%) | Other (%) | |
|---|---|---|---|---|---|
| 2023 | 39.7 | 45 | 0 | 15 | 0.2 |
| 2013 | 49.1 | 37.4 | 0 | 12.4 | 1.1 |
Half of labour migrants leave within four years, but length of stay is increasing
Over the past two years, the number of migrants from India has declined, but they are staying in the Netherlands for longer, on average. Over 56 percent of Indian people who came to the Netherlands in 2019 were still resident four years later, while the other 44 percent had left. Family migrants were more likely to be in the Netherlands after four years (64 percent) than labour migrants (50 percent). Indian labour migrants were slightly more likely to leave the Netherlands than labour migrants from other countries of origin outside the European Union. However, the length of stay among Indian migrants has been increasing in recent years. A smaller share of those who came to the Netherlands in 2011 were still resident after four years: 33 percent of men and 26 percent of women. A larger share of migrants from India now stay for a longer period. This may have to do with the fact that Indian people in the Netherlands are more likely to be living with their families than before. Families are less likely to emigrate than single people.| Total (%) | Labour migrants (%) | Family migrants (%) | |
|---|---|---|---|
| 2010 | 33.8 | 26.9 | 41.8 |
| 2011 | 33.2 | 25.9 | 41.2 |
| 2012 | 35.3 | 29.8 | 40.5 |
| 2013 | 39.6 | 32.8 | 48.2 |
| 2014 | 40.8 | 33.7 | 48.7 |
| 2015 | 43.4 | 37.1 | 49.4 |
| 2016 | 47.0 | 42.5 | 52.5 |
| 2017 | 49.5 | 44.5 | 56.1 |
| 2018 | 52.0 | 45.9 | 60.0 |
| 2019 | 56.3 | 50.3 | 64.4 |
Amstelveen has the highest share of people of Indian origin
People of Indian origin live mainly in the Randstad conurbation and Eindhoven. In absolute terms, the majority are resident in Amsterdam. On 1 January 2024, there were 11 thousand (12 per thousand residents). The municipality of Amstelveen has the highest proportion of residents of Indian origin in comparison to its total population: 6.5 thousand, or 68 per thousand residents. After Amstelveen, the highest share of people with an Indian background live in the neighbouring town of Uithoorn (50 per thousand residents), Eindhoven (35 per thousand residents) and Almere (31 per thousand residents). The provinces of Groningen, Friesland, Drenthe, Overijssel, Gelderland, Zeeland and Limburg have relatively few residents of Indian origin (less than 2 per thousand residents).| gemnaam | Indian people ( per thousand residents) |
|---|---|
| Groningen (gemeente) | 4.6 |
| Almere | 30.7 |
| Stadskanaal | 0.7 |
| Veendam | 0.8 |
| Zeewolde | 0.7 |
| Achtkarspelen | 0.6 |
| Ameland | 4.4 |
| Harlingen | 0.6 |
| Heerenveen | 1.4 |
| Leeuwarden | 3.0 |
| Ooststellingwerf | 0.0 |
| Opsterland | 1.1 |
| Schiermonnikoog | 0.0 |
| Smallingerland | 1.5 |
| Terschelling | 0.0 |
| Vlieland | 0.0 |
| Weststellingwerf | 0.8 |
| Assen | 1.6 |
| Coevorden | 0.6 |
| Emmen | 0.9 |
| Hoogeveen | 0.9 |
| Meppel | 0.6 |
| Almelo | 0.7 |
| Borne | 0.5 |
| Dalfsen | 0.4 |
| Deventer | 1.1 |
| Enschede | 4.9 |
| Haaksbergen | 0.5 |
| Hardenberg | 0.7 |
| Hellendoorn | 0.6 |
| Hengelo (O.) | 1.7 |
| Kampen | 0.9 |
| Losser | 0.3 |
| Noordoostpolder | 0.8 |
| Oldenzaal | 0.8 |
| Ommen | 0.3 |
| Raalte | 0.1 |
| Staphorst | 0.2 |
| Tubbergen | 0.5 |
| Urk | 0.3 |
| Wierden | 0.8 |
| Zwolle | 1.8 |
| Aalten | 0.8 |
| Apeldoorn | 1.7 |
| Arnhem | 7.2 |
| Barneveld | 1.2 |
| Beuningen | 1.3 |
| Brummen | 0.6 |
| Buren | 0.2 |
| Culemborg | 2.4 |
| Doesburg | 0.7 |
| Doetinchem | 0.5 |
| Druten | 0.8 |
| Duiven | 1.1 |
| Ede | 1.5 |
| Elburg | 1.0 |
| Epe | 0.5 |
| Ermelo | 0.9 |
| Harderwijk | 1.2 |
| Hattem | 0.5 |
| Heerde | 0.7 |
| Heumen | 1.2 |
| Lochem | 0.8 |
| Maasdriel | 0.4 |
| Nijkerk | 1.0 |
| Nijmegen | 2.5 |
| Oldebroek | 0.6 |
| Putten | 0.4 |
| Renkum | 0.9 |
| Rheden | 1.4 |
| Rozendaal | 2.7 |
| Scherpenzeel | 1.1 |
| Tiel | 1.2 |
| Voorst | 0.4 |
| Wageningen | 9.1 |
| Westervoort | 0.8 |
| Winterswijk | 0.2 |
| Wijchen | 0.5 |
| Zaltbommel | 0.5 |
| Zevenaar | 0.6 |
| Zutphen | 0.8 |
| Nunspeet | 0.2 |
| Dronten | 1.2 |
| Amersfoort | 3.1 |
| Baarn | 1.6 |
| De Bilt | 2.0 |
| Bunnik | 2.2 |
| Bunschoten | 1.1 |
| Eemnes | 1.0 |
| Houten | 2.9 |
| Leusden | 0.5 |
| Lopik | 0.8 |
| Montfoort | 0.9 |
| Renswoude | 0.5 |
| Rhenen | 0.6 |
| Soest | 1.4 |
| Utrecht (gemeente) | 13.5 |
| Veenendaal | 1.3 |
| Woudenberg | 1.1 |
| Wijk bij Duurstede | 0.6 |
| IJsselstein | 4.9 |
| Zeist | 2.4 |
| Nieuwegein | 18.4 |
| Aalsmeer | 11.6 |
| Alkmaar | 2.0 |
| Amstelveen | 68.3 |
| Amsterdam | 11.8 |
| Bergen (NH.) | 0.5 |
| Beverwijk | 4.8 |
| Blaricum | 1.7 |
| Bloemendaal | 2.1 |
| Castricum | 1.4 |
| Diemen | 14.3 |
| Edam-Volendam | 0.8 |
| Enkhuizen | 1.1 |
| Haarlem | 4.8 |
| Haarlemmermeer | 23.0 |
| Heemskerk | 1.3 |
| Heemstede | 1.4 |
| Heiloo | 0.9 |
| Den Helder | 0.9 |
| Hilversum | 17.8 |
| Hoorn | 2.3 |
| Huizen | 1.1 |
| Landsmeer | 1.5 |
| Laren (NH.) | 1.5 |
| Medemblik | 1.0 |
| Oostzaan | 0.9 |
| Opmeer | 1.0 |
| Ouder-Amstel | 6.6 |
| Purmerend | 3.4 |
| Schagen | 1.0 |
| Texel | 1.7 |
| Uitgeest | 1.3 |
| Uithoorn | 49.6 |
| Velsen | 1.3 |
| Zandvoort | 1.3 |
| Zaanstad | 4.3 |
| Alblasserdam | 0.6 |
| Alphen aan den Rijn | 2.9 |
| Barendrecht | 3.5 |
| Drechterland | 0.7 |
| Capelle aan den IJssel | 7.9 |
| Delft | 17.7 |
| Dordrecht | 1.4 |
| Gorinchem | 1.1 |
| Gouda | 3.8 |
| 's-Gravenhage (gemeente) | 11.1 |
| Hardinxveld-Giessendam | 1.4 |
| Hendrik-Ido-Ambacht | 0.8 |
| Stede Broec | 0.9 |
| Hillegom | 0.7 |
| Katwijk | 1.0 |
| Krimpen aan den IJssel | 1.7 |
| Leiden | 5.9 |
| Leiderdorp | 5.3 |
| Lisse | 0.5 |
| Maassluis | 0.9 |
| Nieuwkoop | 0.5 |
| Noordwijk | 0.7 |
| Oegstgeest | 3.9 |
| Oudewater | 1.3 |
| Papendrecht | 1.4 |
| Ridderkerk | 0.8 |
| Rotterdam | 6.6 |
| Rijswijk (ZH.) | 8.2 |
| Schiedam | 5.2 |
| Sliedrecht | 1.0 |
| Albrandswaard | 2.0 |
| Vlaardingen | 1.3 |
| Voorschoten | 2.9 |
| Waddinxveen | 1.6 |
| Wassenaar | 6.2 |
| Woerden | 2.2 |
| Zoetermeer | 6.1 |
| Zoeterwoude | 1.0 |
| Zwijndrecht | 0.9 |
| Borsele | 1.1 |
| Goes | 1.1 |
| West Maas en Waal | 0.7 |
| Hulst | 1.0 |
| Kapelle | 1.1 |
| Middelburg (Z.) | 1.9 |
| Reimerswaal | 1.0 |
| Terneuzen | 4.0 |
| Tholen | 0.6 |
| Veere | 0.5 |
| Vlissingen | 1.9 |
| De Ronde Venen | 2.7 |
| Tytsjerksteradiel | 0.4 |
| Asten | 0.4 |
| Baarle-Nassau | 0.0 |
| Bergen op Zoom | 1.2 |
| Best | 5.2 |
| Boekel | 0.0 |
| Boxtel | 0.9 |
| Breda | 2.8 |
| Deurne | 0.3 |
| Pekela | 0.2 |
| Dongen | 0.7 |
| Eersel | 1.6 |
| Eindhoven | 35.4 |
| Etten-Leur | 1.6 |
| Geertruidenberg | 0.5 |
| Gilze en Rijen | 0.3 |
| Goirle | 0.3 |
| Helmond | 4.0 |
| 's-Hertogenbosch | 3.5 |
| Heusden | 0.9 |
| Hilvarenbeek | 0.4 |
| Loon op Zand | 0.4 |
| Nuenen, Gerwen en Nederwetten | 3.1 |
| Oirschot | 0.5 |
| Oisterwijk | 0.5 |
| Oosterhout | 1.1 |
| Oss | 0.9 |
| Rucphen | 0.2 |
| Sint-Michielsgestel | 0.6 |
| Someren | 0.3 |
| Son en Breugel | 3.5 |
| Steenbergen | 0.3 |
| Waterland | 1.4 |
| Tilburg | 2.3 |
| Valkenswaard | 3.7 |
| Veldhoven | 16.8 |
| Vught | 0.6 |
| Waalre | 4.9 |
| Waalwijk | 0.8 |
| Woensdrecht | 0.4 |
| Zundert | 0.3 |
| Wormerland | 0.8 |
| Landgraaf | 0.4 |
| Beek (L.) | 0.6 |
| Beesel | 0.2 |
| Bergen (L.) | 0.3 |
| Brunssum | 0.3 |
| Gennep | 0.1 |
| Heerlen | 1.4 |
| Kerkrade | 0.7 |
| Maastricht | 7.4 |
| Meerssen | 0.4 |
| Mook en Middelaar | 0.6 |
| Nederweert | 0.6 |
| Roermond | 2.0 |
| Simpelveld | 0.8 |
| Stein (L.) | 0.2 |
| Vaals | 0.7 |
| Venlo | 1.4 |
| Venray | 0.6 |
| Voerendaal | 0.6 |
| Weert | 1.6 |
| Valkenburg aan de Geul | 0.3 |
| Lelystad | 7.1 |
| Horst aan de Maas | 0.6 |
| Oude IJsselstreek | 0.3 |
| Teylingen | 2.1 |
| Utrechtse Heuvelrug | 1.0 |
| Oost Gelre | 0.3 |
| Koggenland | 1.0 |
| Lansingerland | 2.9 |
| Leudal | 0.4 |
| Maasgouw | 0.5 |
| Gemert-Bakel | 0.6 |
| Halderberge | 0.4 |
| Heeze-Leende | 1.2 |
| Laarbeek | 0.6 |
| Reusel-De Mierden | 0.4 |
| Roerdalen | 1.9 |
| Roosendaal | 0.6 |
| Schouwen-Duiveland | 0.2 |
| Aa en Hunze | 0.7 |
| Borger-Odoorn | 0.5 |
| De Wolden | 0.3 |
| Noord-Beveland | 0.8 |
| Wijdemeren | 1.0 |
| Noordenveld | 0.7 |
| Twenterand | 0.6 |
| Westerveld | 0.3 |
| Lingewaard | 0.5 |
| Cranendonck | 1.5 |
| Steenwijkerland | 1.0 |
| Moerdijk | 0.4 |
| Echt-Susteren | 0.8 |
| Sluis | 0.8 |
| Drimmelen | 0.2 |
| Bernheze | 0.4 |
| Alphen-Chaam | 0.7 |
| Bergeijk | 1.0 |
| Bladel | 0.4 |
| Gulpen-Wittem | 0.3 |
| Tynaarlo | 0.6 |
| Midden-Drenthe | 0.6 |
| Overbetuwe | 1.3 |
| Hof van Twente | 0.4 |
| Neder-Betuwe | 0.0 |
| Rijssen-Holten | 0.5 |
| Geldrop-Mierlo | 6.0 |
| Olst-Wijhe | 0.6 |
| Dinkelland | 0.3 |
| Westland | 0.8 |
| Midden-Delfland | 1.2 |
| Berkelland | 0.2 |
| Bronckhorst | 0.2 |
| Sittard-Geleen | 1.3 |
| Kaag en Braassem | 2.0 |
| Dantumadiel | 0.2 |
| Zuidplas | 1.9 |
| Peel en Maas | 0.5 |
| Oldambt | 0.5 |
| Zwartewaterland | 0.5 |
| Súdwest-Fryslân | 0.9 |
| Bodegraven-Reeuwijk | 1.9 |
| Eijsden-Margraten | 0.4 |
| Stichtse Vecht | 5.6 |
| Hollands Kroon | 0.6 |
| Leidschendam-Voorburg | 17.8 |
| Goeree-Overflakkee | 0.5 |
| Pijnacker-Nootdorp | 4.7 |
| Nissewaard | 1.4 |
| Krimpenerwaard | 0.7 |
| De Fryske Marren | 0.7 |
| Gooise Meren | 2.5 |
| Berg en Dal | 0.5 |
| Meierijstad | 1.1 |
| Waadhoeke | 1.1 |
| Westerwolde | 0.3 |
| Midden-Groningen | 0.7 |
| Beekdaelen | 0.6 |
| Montferland | 0.6 |
| Altena | 0.7 |
| West Betuwe | 0.4 |
| Vijfheerenlanden | 2.3 |
| Hoeksche Waard | 0.8 |
| Het Hogeland | 0.6 |
| Westerkwartier | 0.9 |
| Noardeast-Fryslân | 0.8 |
| Molenlanden | 0.5 |
| Eemsdelta | 0.9 |
| Dijk en Waard | 1.5 |
| Land van Cuijk | 0.5 |
| Maashorst | 0.8 |
| Voorne aan Zee | 0.6 |
Highest immigration from India in 2022
Until the early 2000s, migrants from India were small in number. Before 2005, between 600 and 1,000 Indian people came to the Netherlands each year. Some of these later emigrated, and in terms of net migration, the number of Indian people in the Netherlands rose by 300 per year on average. From 2005 to 2020, migration from India increased rapidly, with a short dip after the financial crisis in 2008. Due to the measures taken to prevent the spread of coronavirus, migration from India fell significantly in 2020, after which it rose again rapidly. The largest number of Indian migrants was seen in 2022, at 11 thousand. After 2022, migration from India to the Netherlands declined for two consecutive years and emigration increased. Net migration estimates indicate that the Indian population in the Netherlands increased by 4 thousand in 2024.
| Net migration (x 1,000) | Immigration (x 1,000) | Emigration (x 1,000) | |
|---|---|---|---|
| 1996 | 0.162 | 0.7 | 0.538 |
| 1997 | 0.407 | 0.807 | 0.4 |
| 1998 | 0.558 | 1.007 | 0.449 |
| 1999 | 0.364 | 0.85 | 0.486 |
| 2000 | 0.365 | 0.782 | 0.417 |
| 2001 | 0.367 | 0.825 | 0.458 |
| 2002 | 0.201 | 0.728 | 0.527 |
| 2003 | 0.243 | 0.735 | 0.492 |
| 2004 | 0.192 | 0.667 | 0.475 |
| 2005 | 0.662 | 1.32 | 0.658 |
| 2006 | 1.103 | 2.121 | 1.018 |
| 2007 | 1.074 | 2.635 | 1.561 |
| 2008 | 1.642 | 3.583 | 1.941 |
| 2009 | 0.861 | 3.226 | 2.365 |
| 2010 | 0.922 | 3.342 | 2.42 |
| 2011 | 1.376 | 3.959 | 2.583 |
| 2012 | 1.175 | 4.124 | 2.949 |
| 2013 | 1.572 | 4.635 | 3.063 |
| 2014 | 2.152 | 5.249 | 3.097 |
| 2015 | 2.784 | 6.342 | 3.558 |
| 2016 | 3.634 | 7.496 | 3.862 |
| 2017 | 4.768 | 8.855 | 4.087 |
| 2018 | 5.964 | 10.816 | 4.852 |
| 2019 | 7.041 | 12.515 | 5.474 |
| 2020 | 1.141 | 6.163 | 5.022 |
| 2021 | 6.011 | 9.965 | 3.954 |
| 2022 | 10.903 | 14.755 | 3.852 |
| 2023 | 7.858 | 12.277 | 4.419 |
| 2024* | 3.981 | 9.392 | 5.411 |
| * provisional figures | |||