Confidence among manufacturers improving in August
Producer confidence in August was below the 20-year average of -1.3. It reached an all-time high (10.4) in October 2021 and an all-time low (-31.5) in April 2020.
| year | month | balance (average of the component questions) |
|---|---|---|
| 2020 | September | -7 |
| 2020 | October | -7.7 |
| 2020 | November | -6.4 |
| 2020 | December | -3.2 |
| 2021 | January | -1.8 |
| 2021 | February | -2.6 |
| 2021 | March | 0.6 |
| 2021 | April | 3.6 |
| 2021 | May | 5.6 |
| 2021 | June | 7.8 |
| 2021 | July | 9.2 |
| 2021 | August | 7.1 |
| 2021 | September | 9.1 |
| 2021 | October | 10.4 |
| 2021 | November | 10.1 |
| 2021 | December | 7.3 |
| 2022 | January | 6.5 |
| 2022 | February | 5.8 |
| 2022 | March | 5.7 |
| 2022 | April | 7.2 |
| 2022 | May | 5.8 |
| 2022 | June | 4.2 |
| 2022 | July | 5.3 |
| 2022 | August | 2.4 |
| 2022 | September | 1.2 |
| 2022 | October | 0.9 |
| 2022 | November | 1.1 |
| 2022 | December | 1 |
| 2023 | January | 1.1 |
| 2023 | February | 0.9 |
| 2023 | March | 0.9 |
| 2023 | April | -0.3 |
| 2023 | May | -1.7 |
| 2023 | June | -2.7 |
| 2023 | July | -2.7 |
| 2023 | August | -4.6 |
| 2023 | September | -3.9 |
| 2023 | Oktober | -3.7 |
| 2023 | November | -2.6 |
| 2023 | December | -5.7 |
| 2024 | January | -4.4 |
| 2024 | February | -4.2 |
| 2024 | March | -4.8 |
| 2024 | April | -3.6 |
| 2024 | May | -2.8 |
| 2024 | June | -2.4 |
| 2024 | July | -2.7 |
| 2024 | August | -1.9 |
Less negative about order positions and stocks
Manufacturers’ assessment of the order positions and their current stocks of finished products was less negative. They were also more positive about expected output for the next three months.
One component indicator was positive: manufacturers who anticipated an increase in output over the next three months outnumbered those expecting a decrease.
Two component indicators were negative. Manufacturers were more likely to indicate that their order position was weak rather than strong for the time of year, and more manufacturers described their current stock of finished products as large rather than small.
| August (balance % positive answers and % negative answers) | July (balance % positive answers and % negative answers) | |
|---|---|---|
| Producer confidence | -1.9 | -2.7 |
| Expected output | 10.7 | 10.4 |
| Assessment of stocks of finished products | -4.9 | -5.8 |
| Assessment of order-book levels | -11.4 | -12.7 |
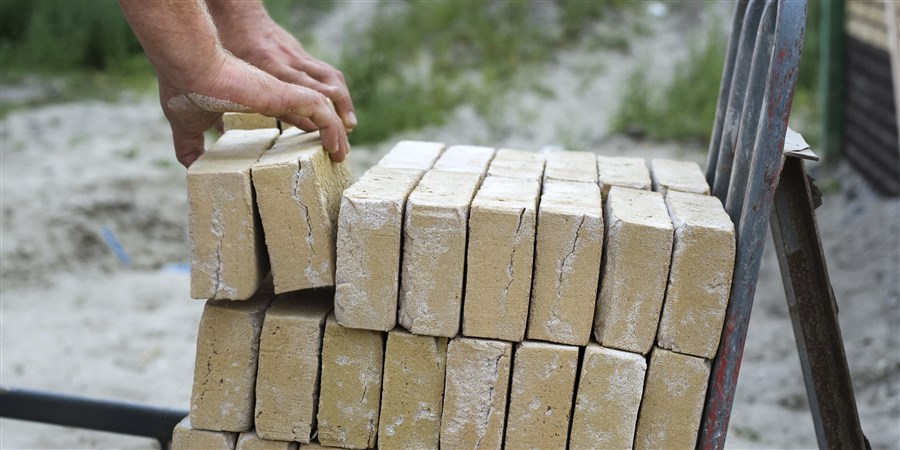
Producer confidence most positive in the timber and construction sector
Confidence improved in most manufacturing sectors. Confidence increased the most among manufacturers in the timber and construction sector. They were also the most positive of all sectors.
More than 3 weeks ago, Statistics Netherlands reported that business confidence had increased the most in the construction sector at the start of the third quarter. However, as in most Dutch sectors, business confidence in the construction sector remained negative.
| August (average of the component questions) | July (average of the component questions) | |
|---|---|---|
| Timber and building materials | 2 | -7.5 |
| Electrotechnical products and machinery | 1.7 | 4.6 |
| Metal | -2.8 | -5.7 |
| Petroleum and chemicals | -3.6 | -3.1 |
| Food, beverages, tobacco | -3.6 | -6.7 |
| Paper and printing | -3.7 | -8.3 |
| Textiles, clothes, leather | -7.2 | -11.1 |
| Transport equipment | -7.5 | -9.9 |
Manufacturing output down by almost 5 percent in June
In June 2024, the calendar-adjusted output of the Dutch manufacturing sector was 4.9 percent lower than it was in June 2023. Year-on-year output also contracted in the preceding eleven months. After adjustments for seasonal and calendar effects, manufacturing output rose by 0.8 percent relative to May.
Sources
Related items
- Dossier - Business cycle
- News - Businesses more positive about profitability