Turnover up in car and motorcycle sector, despite shortages
| Category | Q1 2022 (y-o-y % change) | Q4 2021 (y-o-y % change) |
|---|---|---|
| Motor vehicle and motorcycle sector total | 21.5 | 12.1 |
| Wholesale and retail trade; repair of motor vehicles | 30.2 | 19.9 |
| Wholesale and retail trade; repair of motorcycles | 15.3 | 16.7 |
| Specialised repair workshops | 15.5 | 17.3 |
| Heavy-duty commercial vehicle industry | 12.6 | 13.4 |
| Trade in motor vehicle parts and accessories | 9.0 | 8.5 |
| Importers | 8.4 | -8.0 |
In the sub-sector wholesale and retail trade; repair of motor vehicles, Q1 turnover was up by 30.2 percent year on year. In Q1 2021, earlier lockdowns kept the sub-sector from returning to pre-pandemic turnover levels.
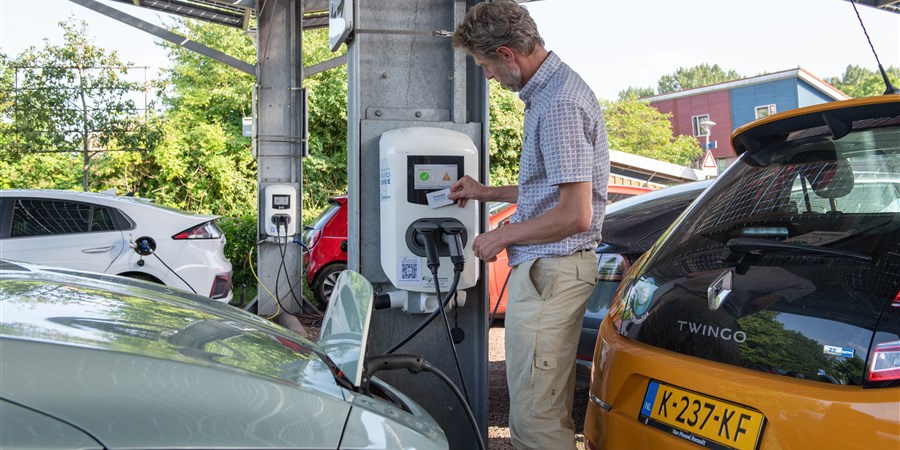
Prices of used cars as well as sales of electric vehicles have increased in recent months, spurred on by the rising price of fuel. Specialised repair workshops achieved 15.5 percent more turnover in Q1 2022 than one year previously.
Turnover in wholesale and retail trade and repair services of motorcycles increased by 15.3 percent relative to Q1 2021. Motorcycle retail trade performed well in particular. Compared to previous years, sales of both new and used motorcycles were high in the first quarter of this year.
Heavy-duty commercial vehicle industry affected by war in Ukraine
With 12.6 percent growth, Q1 turnover was also higher in the heavy-duty commercial vehicle industry. However, the industry did face a number of factory closures. The war in Ukraine affected the supply of specific components such as wiring harnesses. In addition, the industry is still being affected by microchip shortages.
The sale of caravans - also a part of this industry - continues to flourish. Q1 saw yet again more caravans sold.
Higher turnover in component trade due to price increases
Partly as a result of price increases, turnover in component trade increased by 9 percent in Q1 2022 relative to the same quarter of 2021.
At the same time, imports of new passenger cars grew by 8.4 percent, partly due to rising demand for electric cars. This industry as well was hobbled by the faltering supply of components. Because of the war in Ukraine, several factories shut down, compromising the supply of vehicle components. In addition, car manufacturers withdrew from Russia.
More positive outlook in car and motorcycle industry
At the start of Q2, business confidence in the motor vehicle and motorcycle industry stood at 4.5. This was still 1.7 at the start of Q1. The mood is therefore slightly more positive, but less so than in Q3 2021, when business confidence reached an all-time peak of 16.1.
In comparison with other industries, the motor vehicle and motorcycle industry shows lower business confidence as the indicator across the industries is positioned at 16.4.
| Sector | Q2 | Q1 |
|---|---|---|
| Total non-financial sector | 16.8 | 6.4 |
| Accommodation and food services | 40.9 | -35.3 |
| Wholesale and commission trade | 18.4 | 9.9 |
| Information and communication | 17.2 | 4.6 |
| Transportation and storage | 13.1 | 14.1 |
| Construction | 12.5 | 23.1 |
| Manufacturing | 10.8 | 9.0 |
| Real estate activities | 6.2 | 6.0 |
| Wholesale and retail trade and repair of motor vehicles | 4.5 | 1.7 |
| Retail trade (excl. motor vehicles) | 1.8 | -5.0 |
| Mining and quarrying | -2.0 | 4.5 |
| Source: CBS, EIB,KVK,MKB-Nederland,VNO-NCW | ||
Outlook influenced by labour market tension
Just as in other industries, there is labour market tension in the motor vehicle and motorcycle industry. Approximately 23.4 percent of businesses reported a labour shortage in Q2 2022, roughly the same share as in the previous quarter.
There were 7.3 thousand unfilled vacancies in the industry in Q1. This is the highest number of vacancies since 1997. The number has been on the rise since Q2 2020, when it still stood at 2.3 thousand.
| Year | Quarter | Unfilled vacancies (x 1,000) |
|---|---|---|
| 2018 | Q1 | 4.3 |
| 2018 | Q2 | 4.9 |
| 2018 | Q3 | 3.9 |
| 2018 | Q4 | 4.6 |
| 2019 | Q1 | 4.8 |
| 2019 | Q2 | 4.6 |
| 2019 | Q3 | 4.3 |
| 2019 | Q4 | 4.0 |
| 2020 | Q1 | 2.8 |
| 2020 | Q2 | 2.3 |
| 2020 | Q3 | 3.0 |
| 2020 | Q4 | 2.6 |
| 2021 | Q1 | 3.1 |
| 2021 | Q2 | 4.6 |
| 2021 | Q3 | 5.3 |
| 2021 | Q4 | 6.2 |
| 2022 | Q1 | 7.2 |