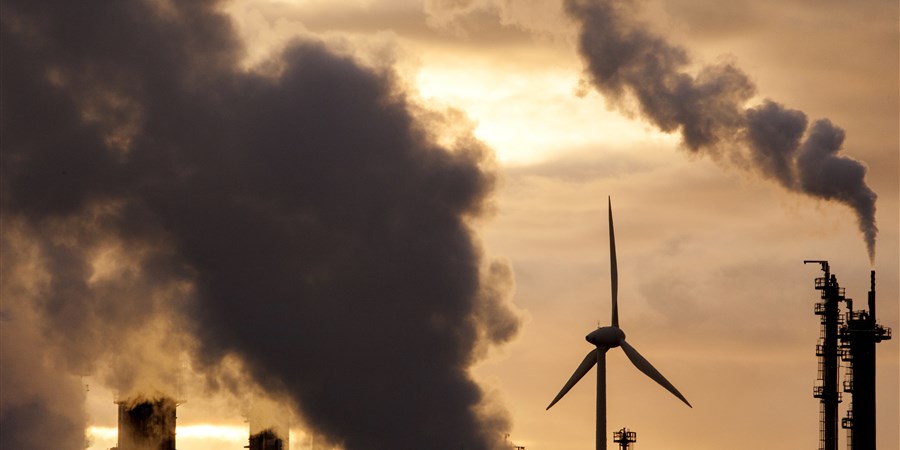
Slight drop in greenhouse gas emissions
| Jaartal | Carbon dioxide (other sectors) (bn CO2 equivalents) | Carbon dioxide (energy companies) (bn CO2 equivalents) | Carbon dioxide (manufacturing) (bn CO2 equivalents) | Other greenhouse gases (bn CO2 equivalents) | 2020 target: 166 bn CO2 equivalents (bn CO2 equivalents) |
|---|---|---|---|---|---|
| 1990 | 72.00 | 39.80 | 51.50 | 58.40 | 166 |
| 1991 | 77.70 | 40.30 | 53.70 | 57.60 | 166 |
| 1992 | 76.30 | 40.80 | 54.40 | 58.50 | 166 |
| 1993 | 79.50 | 42.00 | 50.10 | 59.10 | 166 |
| 1994 | 76.10 | 45.80 | 50.20 | 59.40 | 166 |
| 1995 | 78.90 | 47.90 | 46.90 | 58.00 | 166 |
| 1996 | 86.60 | 48.50 | 48.00 | 59.60 | 166 |
| 1997 | 79.90 | 48.60 | 47.40 | 58.60 | 166 |
| 1998 | 79.30 | 50.30 | 47.40 | 58.00 | 166 |
| 1999 | 78.10 | 47.20 | 46.30 | 50.10 | 166 |
| 2000 | 78.10 | 48.40 | 45.90 | 47.40 | 166 |
| 2001 | 80.10 | 52.00 | 45.50 | 42.90 | 166 |
| 2002 | 79.00 | 53.00 | 44.80 | 41.50 | 166 |
| 2003 | 80.60 | 53.80 | 45.90 | 38.70 | 166 |
| 2004 | 81.30 | 55.00 | 45.60 | 38.50 | 166 |
| 2005 | 80.20 | 52.20 | 45.50 | 36.80 | 166 |
| 2006 | 80.50 | 48.00 | 44.70 | 36.50 | 166 |
| 2007 | 76.80 | 50.60 | 45.60 | 35.10 | 166 |
| 2008 | 80.80 | 50.00 | 45.10 | 31.60 | 166 |
| 2009 | 79.50 | 49.90 | 41.20 | 31.20 | 166 |
| 2010 | 86.50 | 52.00 | 44.10 | 31.20 | 166 |
| 2011 | 78.20 | 47.70 | 43.70 | 30.10 | 166 |
| 2012 | 78.50 | 44.80 | 43.00 | 29.50 | 166 |
| 2013 | 79.00 | 44.90 | 42.30 | 29.20 | 166 |
| 2014 | 68.80 | 48.50 | 41.90 | 28.50 | 166 |
| 2015 | 70.90 | 53.20 | 42.80 | 29.10 | 166 |
| 2016 | 71.30 | 52.00 | 43.50 | 29.00 | 166 |
| 2017 | 71.70 | 48.40 | 44.80 | 28.80 | 166 |
| 2018 | 71.80 | 45.30 | 44.10 | 28.30 | 166 |
| Source: CBS, RIVM/Emissieregistratie | |||||
In 2018, greenhouse gas emissions in the Netherlands amounted to 189.5 billion CO2 equivalents, which is 4.2 billion CO2 equivalents (2 percent) less than in the previous year. The bulk of this reduction (75 percent) is related to lower CO2 emissions by energy companies. The remaining part can be attributed to a reduced cattle herd (lower methane emissions), which in turn is related to the introduction of the phosphate rights trading system and to lower CO2 emissions by the manufacturing industry.
The Netherlands aims to reduce its greenhouse gas emissions in 2020 to a 25 percent lower level than in 1990. In 2018, emissions were down by 14.5 percent relative to 1990. According to the most recent figures available at European level (2017), greenhouse gas emissions per capita are fairly high in the Netherlands: 11.3 tonnes of CO2 equivalents, which is 34 percent above the EU average.
CO2 emissions by energy companies back at 2013 level
Last year, the Netherlands emitted 161 billion kg of carbon dioxide (CO2), representing a decline of 4 billion or 2 percent on the previous year. Between 2017 and 2018, CO2 emissions by energy companies fell from 48 to 45 billion kg, back at the level of 2013.
In 2015, CO2 emission levels peaked as a result of new coal plants put into service and dropped in subsequent years as old plants were being closed down step by step. Last year, the discontinuation of electricity production by coal-fired plants was compensated by higher electricity imports, while gas-fired plants continued to run at the same level.
| Total (bn kg) | Coal (bn kg) | Natural gas and other (bn kg) | |
|---|---|---|---|
| 1990 | 39.80 | 21.90 | 17.90 |
| 1991 | 40.30 | 19.70 | 20.60 |
| 1992 | 40.80 | 19.50 | 21.30 |
| 1993 | 42.00 | 18.90 | 23.10 |
| 1994 | 45.80 | 21.70 | 24.10 |
| 1995 | 47.90 | 23.00 | 24.90 |
| 1996 | 48.50 | 21.70 | 26.80 |
| 1997 | 48.60 | 20.40 | 28.20 |
| 1998 | 50.30 | 21.50 | 28.80 |
| 1999 | 47.20 | 17.80 | 29.40 |
| 2000 | 48.40 | 19.80 | 28.60 |
| 2001 | 52.00 | 21.20 | 30.80 |
| 2002 | 53.00 | 21.40 | 31.60 |
| 2003 | 53.80 | 21.80 | 32.00 |
| 2004 | 55.00 | 21.10 | 33.90 |
| 2005 | 52.20 | 19.70 | 32.50 |
| 2006 | 48.00 | 19.30 | 28.70 |
| 2007 | 50.60 | 20.30 | 30.30 |
| 2008 | 50.00 | 19.50 | 30.50 |
| 2009 | 49.90 | 19.50 | 30.40 |
| 2010 | 52.00 | 18.40 | 33.60 |
| 2011 | 47.70 | 17.30 | 30.40 |
| 2012 | 44.80 | 19.90 | 24.90 |
| 2013 | 44.90 | 20.80 | 24.10 |
| 2014 | 48.50 | 24.10 | 24.40 |
| 2015 | 53.20 | 31.40 | 21.80 |
| 2016 | 52.00 | 28.40 | 23.60 |
| 2017 | 48.40 | 23.80 | 24.60 |
| 2018 | 45.30 | 20.60 | 24.70 |
| Source: CBS, RIVM/Emissieregistratie | |||
Economy up, emissions down
Relative to three years previously, greenhouse gas emissions dropped by 3 percent in 2018. At the same time, the Dutch economy grew by 8 percent. This means that the emission intensity of the Dutch economy has declined by 10 percent. This is partly related to the closure of old coal plants, an increase in renewable energy consumption, continuing energy savings and a growing share of the service sector in the total economy. As a result, last year’s emission intensity was down by 44 percent relative to 1990.
| Emission intensity (2015=100) | Economic growth (2015=100) | Greenhouse gas emissions (2015=100) | |
|---|---|---|---|
| 2015 | 100 | 100 | 100 |
| 2016 | 98 | 102 | 100 |
| 2017 | 94 | 105 | 99 |
| 2018 | 90 | 108 | 97 |
High emission intensity in Eastern Europe
In 2017, the emission intensity in the Netherlands was slightly above (3 percent) the EU average (257 CO2 equivalents per 1,000 euros of GDP). Seventeen EU countries, mainly in Eastern Europe, have a higher emission intensity than the Netherlands. It is highest in Bulgaria, namely four times higher than the EU average. The best performing countries have a relatively large manufacturing industry.
Countries such as France, Austria and Sweden have low scores, mainly because they use relatively few fossil fuels in their electricity production processes. France has many nuclear power plants and Austria has several hydro power plants while Sweden relies heavily on both nuclear energy and hydro power. The lowest emission intensity in Europe is recorded in Sweden, i.e. half the EU average.
| CO2 equivalents ( per 1,000 euros of GDP) | |
|---|---|
| Sweden | 125 |
| France | 160 |
| Luxembourg | 166 |
| Austria | 172 |
| United Kingdom | 182 |
| Italy | 203 |
| Ireland | 211 |
| Belgium | 219 |
| Spain | 255 |
| Germany | 255 |
| Netherlands | 265 |
| Finland | 271 |
| Malta | 309 |
| Denmark | 314 |
| Portugal | 372 |
| Slovenia | 395 |
| Cyprus | 404 |
| Latvia | 446 |
| Croatia | 454 |
| Slovakia | 461 |
| Greece | 464 |
| Hungary | 472 |
| Czech Republic | 587 |
| Romania | 589 |
| Lithuania | 619 |
| Poland | 860 |
| Estonia | 975 |
| Bulgaria | 1112 |
Sources
- StatLine - Greenhouse gas emissions (1990-2017)
- Environmental Data Compendium - Greenhouse gas emissions
Related items
- News release - Energy consumption down in 2018
- Publication - The Netherlands on the European scale