Leiden’s educational opportunities into clear focus

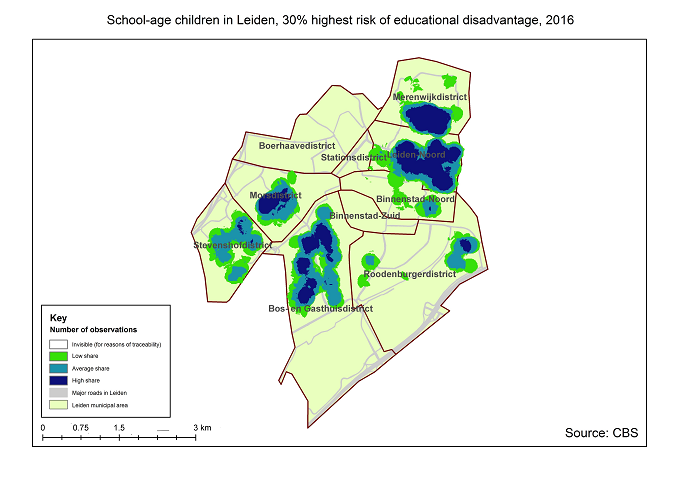
This is the outcome of a survey held by the Urban Data Centre Leiden071, a collaboration between Statistics Netherlands (CBS) and the municipality of Leiden. Specially developed heatmaps in this research provide more insight into the geographical spread across the municipality of children with increased risk of educational disadvantage, alongside tables with numbers at district level. The insight obtained can help the municipality of Leiden in further shaping their local policy on educational opportunities.
National model
To help determine educational opportunities, the UDC made use of a model that was developed previously for the Ministry of Education, Culture and Science. The ministry is planning to use this model to tackle educational disadvantage while assigning future budgets to municipalities and schools. The model calculates the expected school achievements of all primary school children in the Netherlands based on their background and environmental characteristics. To help finalise the budget allocation, the survey also looked at the effects for schools and municipalities of imposing various threshold values.
Under the 10% threshold value, a group of children with the 10% lowest expected test scores - and therefore the highest risk of educational disadvantage - has been studied. By way of comparison, a 30% threshold value refers to a group of children comprising the 30% lowest scoring pupils.
Leiden
CBS studied how many children attending primary school and living in Leiden are at risk of a greater educational disadvantage. Under the 30% national threshold, this group consists of 2,115 children, equivalent to 25 percent of all primary pupils in Leiden (altogether 8,500).
Likewise, the percentage shares in Leiden of such groups under the various threshold values (i.e. 10%, 15% and 20% highest risk of educational disadvantage) are lower than the national average.
| National threshold (%) | Leiden (%) | |
|---|---|---|
| Threshold value 10% | 10 | 9 |
| Threshold value 15% | 15 | 14 |
| Threshold value 20% | 20 | 18 |
| Threshold value 30% | 30 | 25 |
Gaps between districts
CBS also studied how the group with educational disadvantage is spread across the different districts of Leiden. It emerged that, when looking at the group of children with the 30% highest risk of educational disadvantage, the districts of Leiden-Noord and Bos- en Gasthuis have relatively greater shares of pupils with an educational disadvantage compared to the national average.
Heatmaps offer more detail
The geographical distribution of the high-risk group over the municipality can be seen in the heatmaps specifically developed for this study. The heatmaps demonstrate how the district of Merenwijk scores around the national average threshold values but still has high concentrations of children with an elevated risk of educational disadvantage. Heatmaps showing distributions across the municipality are available for all threshold values set out here, including both school-age children and children under compulsory school age (i.e. 2.5 to under 5 years of age). For children under compulsory school age, a similar study was conducted, which shows only minor differences compared to the group of school-age children.
The municipality of Leiden is very pleased with the research report: ‘The intense efforts of the municipality over the past few years have helped, but we’re not there yet. Although Leiden is doing relatively well compared to the country overall, there are districts in Leiden with more children at risk of disadvantage than the national average. It gives the municipality insight into the districts where extra investments are needed in terms of educational opportunities.’

The study on educational opportunities is the second study conducted at the Urban Data Centre Leiden071. Earlier this year, a study was undertaken on the coverage rate of the municipality’s financial assistance schemes among eligible households (based on income and private asset levels).
Related items
- Background - UDC Leiden