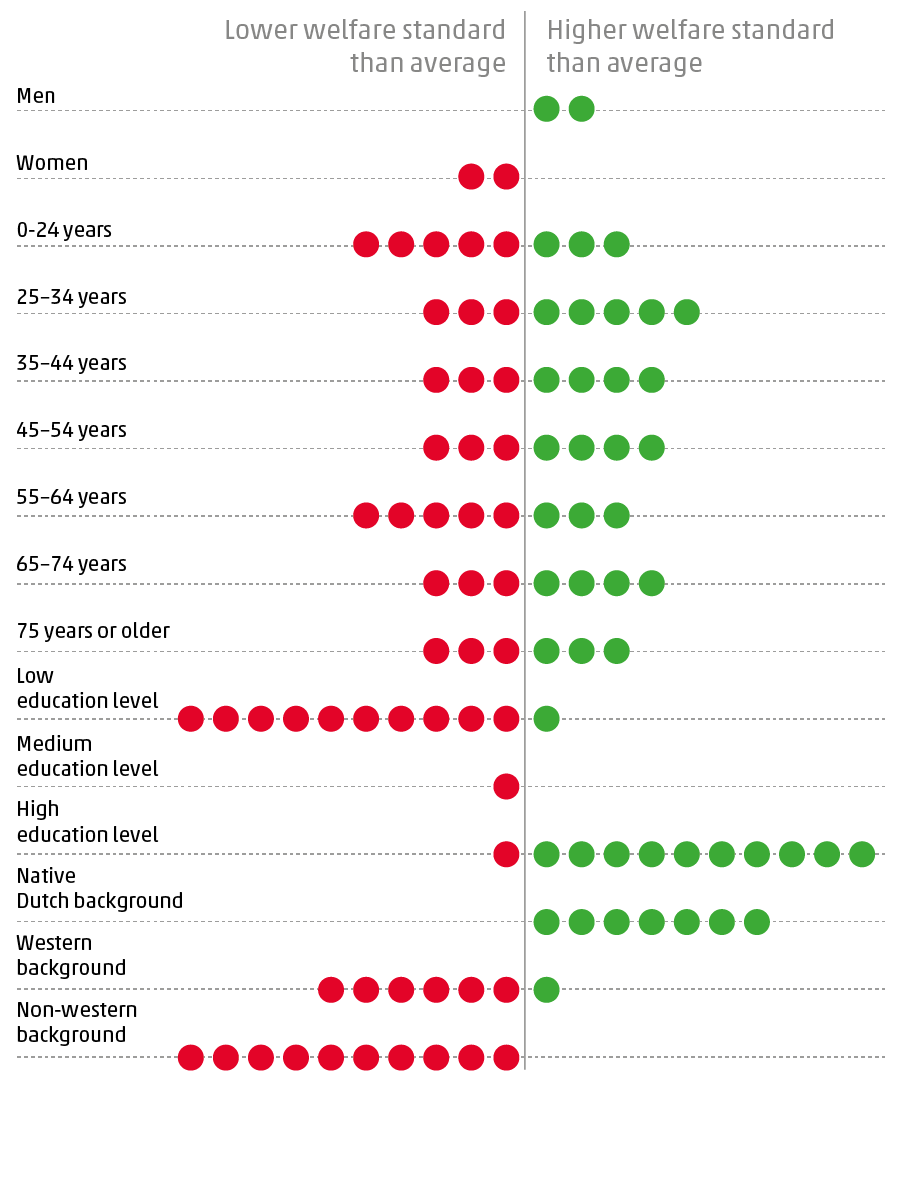
Well-being not distributed equally

For the purpose of assessing the disparities under the ten themes, CBS uses a total of twelve indicators, namely: satisfaction with life, personal well-being, income, wealth, education level, unemployment, perceived health, crime and victim rates, perceived housing costs, volunteer work, trust in other people, and satisfaction with commuting time.

High well-being among higher educated and native Dutch
In most areas, people with higher levels of education enjoy a higher level of well-being than those with lower levels. This is the case for income, wealth, unemployment, health, self-perceived cost of housing, volunteer work, trust in other people, satisfaction with life and personal well-being. However, the higher educated are relatively more often victim of crime. Levels of well-being among people with intermediate levels of education are similar to the overall level of well-being of the population in most areas.Another noteworthy finding is that in many areas, people with a migration background – and particularly those with a non-western background – have lower levels of well-being than native Dutch people. These disparities are party related to the fact that people with a non-western migration background are relatively younger and lower educated than average.
Fewer disparities by age and gender
For almost all indicators, disparities are seen among the different age groups, although no distinct pattern emerges. Young people tend to have a relatively low income and low level of wealth, for instance. In addition, young people are more likely to be victims of crime than older people. In terms of health, the opposite is true: the percentage of people with a positive perception of their own health decreases with age. Education levels are also higher among young people than among the older age groups.Differences in well-being between men and women are small. Their respective positions hardly deviate from the average for ten out of the twelve indicators. However, men are less often affected by unemployment and have a more positive perception of their own health.
Lower educated less positive about personal well-being
The fact that higher educated people have a relatively higher level of well-being in most areas is also evident from their personal well-being: over three-quarters are positive compared with half of lower educated people. The personal well-being index (PWI) is a holistic index summarising the individual perceptions of people with respect to several relevant areas of life, including financial situation, social life and health. In all areas except social life, the higher educated are more positive than those with low education levels.
At 44.6 percent, the share of people with a non-western migration background with high personal well-being is smaller than among native Dutch people (64.8 percent). Situated in between these two groups are the people with a western migration background. Trust in social and political institutions is the only aspect in the personal well-being index which is rated more favourably by people with a non-western migration background than by native Dutch members of society.
| High personal well-being (% of adults) | |
|---|---|
| Total | 62 |
| Education level | |
| Low | 50.9 |
| Intermediate | 59.3 |
| High | 75.5 |
| Migration background | |
| Native Dutch | 64.8 |
| Western | 59 |
| Non-western | 44.6 |
Higher educated more likely to be crime victims
For almost all indicators, well-being is higher among higher educated people than among lower educated people. This is not the case for the indicator on security, however: higher educated people have higher crime victim rates (18.5 percent) than medium (15.4 percent) and lower educated people (11.9 percent).
The crime victim rate is virtually the same for people with a native Dutch background and people with a western migration background (14.5 and 15.4 percent, respectively). Those with a non-western migration background are more likely to be crime victims (19.5 percent) than average. This cannot be explained by the younger age than average which prevails among the group with a non-western migration background.
| Crime victims (% of adults) | |
|---|---|
| Total | 15.2 |
| Education level | |
| Low | 11.9 |
| Intermediate | 15.4 |
| High | 18.5 |
| Migration background | |
| Native Dutch | 14.5 |
| Western | 15.4 |
| Non-western | 19.5 |
Sources
- News release - Well-being improving