Unemployment continues to fall in January 2018

The other group without work, nearly 3.9 million people, had not been looking and/or been immediately available for work recently. Their number has remained unchanged, according to CBS figures. The Employee Insurance Agency (UWV) recorded a small increase in the number of unemployment (WW) benefits to a total of 335 thousand in January.
Unemployment rate (ILO definition) down to 4.2 percent
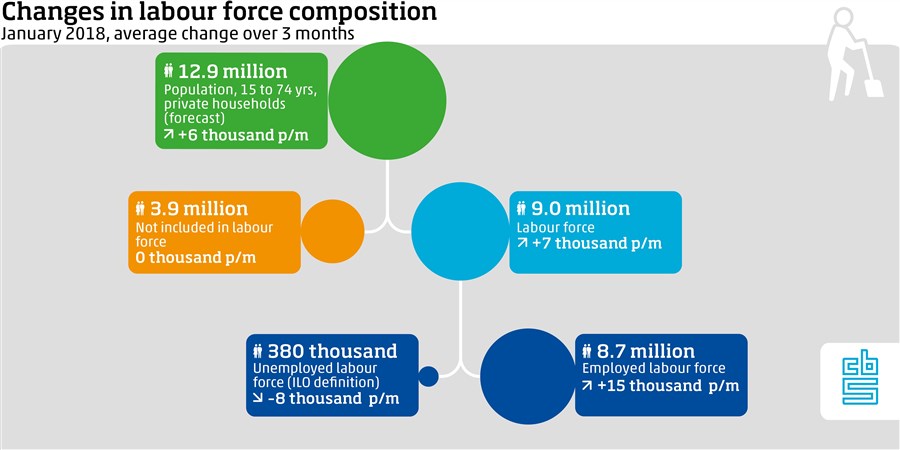
In order to enable comparison of cyclical developments in the labour market between countries, the unemployment indicator of the International Labour Organization (ILO) is often taken as a measure. According to this indicator, the ‘unemployed’ includes all 15 to 74-year-olds who do not have paid work but who are actively looking and immediately available for paid work. There were 380 thousand unemployed in January, equivalent to 4.2 percent of the labour force. This stood at 4.4 percent one month previously.
The unemployment rate does not include all unemployed people who are willing to work. People who do want to work but who have not sought work and/or have been available recently for any particular reason, do not count towards ILO’s unemployment definition. By the same token, part-time workers who want to work more hours are not considered to be unemployed. CBS describes these groups on a quarterly basis, aside from quarterly reporting on the number of hours worked by people in paid employment. Monthly figures on people in paid employment (the active labour force) include all people in work, regardless of the number of hours worked.
| Unemployment indicator (ILO) (15-74 yrs, seasonally adjusted) (x 1,000) | Unemployment benefits (15 yrs to pension entitlement age) (x 1,000) | ||
|---|---|---|---|
| 2011 | J | 430 | 284 |
| 2011 | F | 425 | 280 |
| 2011 | M | 413 | 270 |
| 2011 | A | 411 | 261 |
| 2011 | M | 414 | 256 |
| 2011 | J | 409 | 252 |
| 2011 | J | 425 | 254 |
| 2011 | A | 427 | 256 |
| 2011 | S | 442 | 252 |
| 2011 | O | 458 | 253 |
| 2011 | N | 474 | 258 |
| 2011 | D | 473 | 270 |
| 2012 | J | 486 | 292 |
| 2012 | F | 482 | 299 |
| 2012 | M | 487 | 296 |
| 2012 | A | 502 | 292 |
| 2012 | M | 501 | 291 |
| 2012 | J | 502 | 291 |
| 2012 | J | 518 | 298 |
| 2012 | A | 517 | 304 |
| 2012 | S | 530 | 304 |
| 2012 | O | 539 | 310 |
| 2012 | N | 554 | 322 |
| 2012 | D | 572 | 340 |
| 2013 | J | 589 | 369 |
| 2013 | F | 601 | 377 |
| 2013 | M | 619 | 380 |
| 2013 | A | 625 | 380 |
| 2013 | M | 632 | 378 |
| 2013 | J | 648 | 382 |
| 2013 | J | 666 | 395 |
| 2013 | A | 670 | 399 |
| 2013 | S | 675 | 400 |
| 2013 | O | 680 | 408 |
| 2013 | N | 677 | 419 |
| 2013 | D | 687 | 438 |
| 2014 | J | 691 | 460 |
| 2014 | F | 699 | 460 |
| 2014 | M | 692 | 454 |
| 2014 | A | 684 | 443 |
| 2014 | M | 672 | 436 |
| 2014 | J | 656 | 431 |
| 2014 | J | 648 | 437 |
| 2014 | A | 637 | 430 |
| 2014 | S | 630 | 420 |
| 2014 | O | 632 | 419 |
| 2014 | N | 635 | 425 |
| 2014 | D | 643 | 441 |
| 2015 | J | 645 | 458 |
| 2015 | F | 633 | 455 |
| 2015 | M | 626 | 443 |
| 2015 | A | 625 | 427 |
| 2015 | M | 617 | 416 |
| 2015 | J | 611 | 410 |
| 2015 | J | 603 | 420 |
| 2015 | A | 604 | 420 |
| 2015 | S | 609 | 417 |
| 2015 | O | 616 | 421 |
| 2015 | N | 596 | 427 |
| 2015 | D | 588 | 446 |
| 2016 | J | 574 | 465 |
| 2016 | F | 581 | 469 |
| 2016 | M | 574 | 470 |
| 2016 | A | 572 | 461 |
| 2016 | M | 560 | 448 |
| 2016 | J | 550 | 438 |
| 2016 | J | 541 | 432 |
| 2016 | A | 521 | 427 |
| 2016 | S | 510 | 424 |
| 2016 | O | 502 | 420 |
| 2016 | N | 499 | 410 |
| 2016 | D | 482 | 412 |
| 2017 | J | 480 | 419 |
| 2017 | F | 473 | 416 |
| 2017 | M | 463 | 415 |
| 2017 | A | 456 | 401 |
| 2017 | M | 456 | 386 |
| 2017 | J | 446 | 372 |
| 2017 | J | 436 | 364 |
| 2017 | A | 426 | 362 |
| 2017 | S | 422 | 351 |
| 2017 | O | 404 | 343 |
| 2017 | N | 397 | 337 |
| 2017 | D | 395 | 330 |
| 2018 | J | 380 | 335 |
| Source: CBS, UWV | |||
UWV: Slightly more WW benefits than in December 2017
In January 2018, the number of current WW benefits increased by 5 thousand (+1.5 percent) relative to December 2017, ending at 335 thousand benefits. The increase is related to seasonal influences and is sharpest in agriculture and fisheries, in construction and at temporary employment agencies. Year-on-year, on the other hand, there was an above-average decline in the number of current unemployment benefits at temporary employment agencies and in construction in 2017. The number of WW benefits among women remained virtually unchanged after December, versus an increase in benefits among the male labour force. This can be explained by the fact that men are relatively often employed in seasonally sensitive sectors of industry.UWV: Sharp drop in WW benefits year-on-year in technical occupations
Relative to twelve months previously, the number of WW benefits declined by 20 percent in January. The sharpest decline was seen in technical occupations as well as in transportation and logistics. The most substantial drop was seen in technical occupations at -38.9 percent.Youth unemployment below pre-crisis level
Unemployment was at a peak in February 2014: 7.9 percent. Since then, it has declined almost continually. In January, the unemployment rate stood at 4.2 percent, still slightly above the pre-crisis level of 3.6 percent in November 2008. However, youth unemployment is now at a lower level than before the economic crisis; last month, it stood at 7.4 percent of the labour force against 8.5 percent in November 2008. A decrease is mainly seen among the unemployed youth who are no longer in education: 5.8 percent of this group were unemployed in Q4 2017 versus 7.6 percent in Q4 2008.
| November 2008 (%) | February 2014 (%) | January 2018 (%) | |
|---|---|---|---|
| Total | 3.6 | 7.9 | 4.2 |
| 15 to 24 yrs | 8.5 | 13.8 | 7.4 |
| 25 to 44 yrs | 2.5 | 6.9 | 3.2 |
| 45 to 74 yrs | 2.9 | 6.6 | 3.9 |
Unused labour potential
Every month, CBS publishes figures on the size of the employed and unemployed labour force, as well as the group not included in the labour force (ILO definition). However, the unemployed labour force does not include all unused labour potential; other groups form part of the unused labour potential, aside from the unemployed according to the ILO indicator. The size and composition of these groups are reported on every quarter. The overall picture described below is therefore based on the latest quarterly figures (Q3 2017). Developments in total unused labour potential are closely linked with developments in unemployment according to the ILO definition.Almost 8.7 million employed in Q4 2017
In Q4 2017, almost 8.7 million out of the 12.9 million people aged 15 to 74 years were in paid employment, while 391 thousand were unemployed (ILO unemployment indicator, not seasonally adjusted). These included 138 thousand who had been looking for work for twelve months or more. Almost two in three long-term unemployed were at least 45 years old. Those in employment and the unemployed together comprise the Dutch labour force.
Unused labour potential does not only comprise people without work. Among the 4.2 million people working part-time, 420 thousand were seeking more working hours in Q4, who were also immediately available for more work. In Q4 2017, total unused labour potential stood at over 1.2 million, versus close to 1.4 million one year previously.
Explanation
Every month, CBS publishes figures on the labour force in accordance with international guidelines. The corresponding indicators, i.e. the employed and unemployed labour force, are used around the world to describe cyclical developments on the labour market. Monthly figures are essential in this respect. In addition, UWV issues its own monthly figures on unemployment benefits; however, these do not correspond with the indicators on the labour force.