Improved nutrient efficiency in agriculture

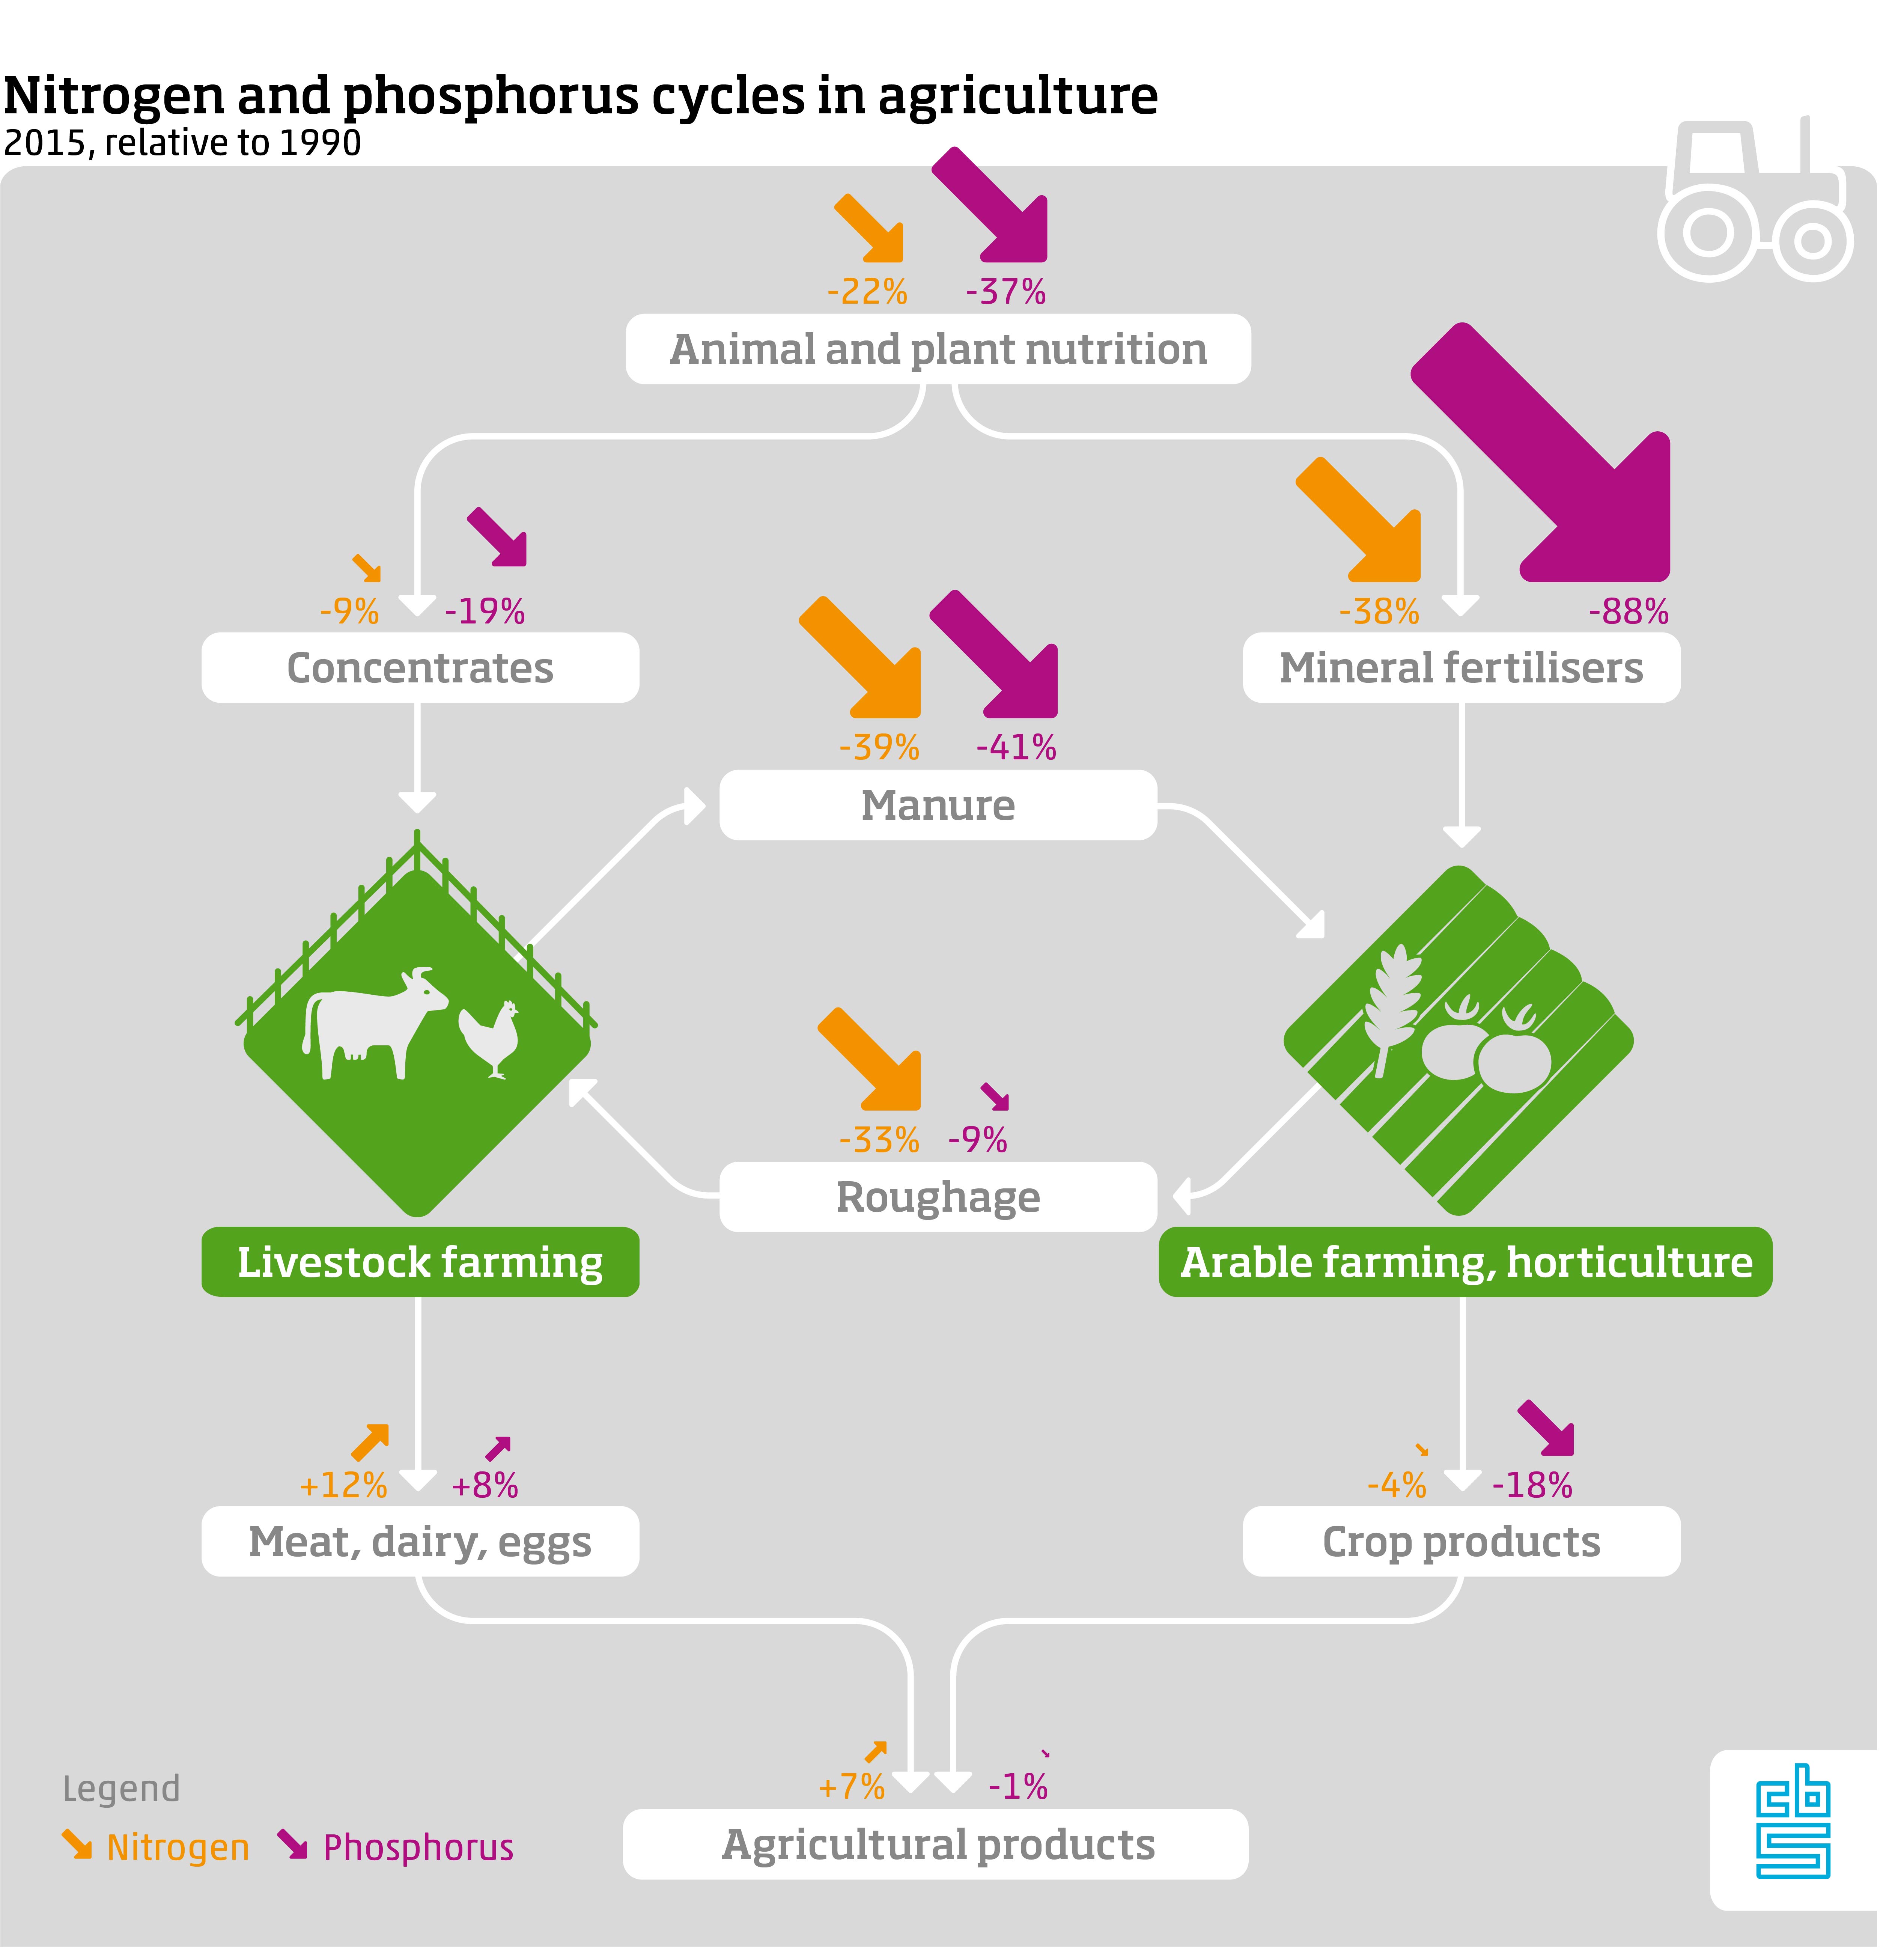
In 1990, 31 percent of nitrogen from livestock feed and mineral fertilisers was converted into animal and crop products. In 2015 the so-called nitrogen use-efficiency had risen to 47 percent, reducing levels of nitrogen loss. This percentage has remained fairly constant over the past few years. Phosphorus use-efficiency even increased from 44 to 93 percent; a continuing upward trend instead.
| Nitrogen | Phosphorus | |
|---|---|---|
| 1990 | 31 | 44 |
| 1991 | 30 | 43 |
| 1992 | 31 | 43 |
| 1993 | 32 | 46 |
| 1994 | 32 | 47 |
| 1995 | 31 | 49 |
| 1996 | 32 | 49 |
| 1997 | 32 | 50 |
| 1998 | 31 | 48 |
| 1999 | 34 | 52 |
| 2000 | 37 | 53 |
| 2001 | 40 | 60 |
| 2002 | 41 | 62 |
| 2003 | 39 | 59 |
| 2004 | 40 | 65 |
| 2005 | 41 | 62 |
| 2006 | 39 | 60 |
| 2007 | 42 | 68 |
| 2008 | 46 | 74 |
| 2009 | 48 | 85 |
| 2010 | 48 | 71 |
| 2011 | 48 | 80 |
| 2012 | 49 | 90 |
| 2013 | 48 | 88 |
| 2014 | 49 | 87 |
| 2015 | 47 | 93 |
Less nutrient runoff into soils and air
The Dutch minerals policy of the past 25 years has effectively resulted in decreasing losses of nutrient input on farms. Overfertilisation has been reduced, while fertiliser application methods have become less wasteful. In 1990 nitrogen losses in agricultural soil amounted to 361 million kg. This had declined to 242 million kg in 2015. The loss of nitrogen to air declined from 263 million kg in 1990 to 90 million kg in 2015. Nowadays, efficiency in fertilisation of agricultural land has improved, while losses from animal houses and manure storage have been reduced.
| Into soil | Into air | |
|---|---|---|
| 1990 | 361 | 263 |
| 1991 | 375 | 271 |
| 1992 | 380 | 218 |
| 1993 | 374 | 220 |
| 1994 | 418 | 181 |
| 1995 | 473 | 158 |
| 1996 | 430 | 162 |
| 1997 | 416 | 151 |
| 1998 | 464 | 137 |
| 1999 | 416 | 136 |
| 2000 | 362 | 119 |
| 2001 | 315 | 115 |
| 2002 | 259 | 110 |
| 2003 | 324 | 109 |
| 2004 | 286 | 106 |
| 2005 | 275 | 104 |
| 2006 | 281 | 106 |
| 2007 | 252 | 104 |
| 2008 | 222 | 94 |
| 2009 | 217 | 94 |
| 2010 | 211 | 94 |
| 2011 | 212 | 83 |
| 2012 | 208 | 83 |
| 2013 | 212 | 84 |
| 2014 | 191 | 88 |
| 2015 | 242 | 90 |
Phosphorus losses only occur in soil and this has declined from 69 million kg in 1990 to 6 million kg in 2015. Most striking is the decrease in phosphorus application through mineral fertilisers: an 88 percent drop since 1990. The Dutch agricultural sector therefore appears to be approaching its goal of zero loss to soil, despite the fact that phosphorus from produced animal manure was still slightly above the phosphate ceiling set by the EU.
| Phosphorus losses in soil | |
|---|---|
| 1990 | 69 |
| 1991 | 77 |
| 1992 | 69 |
| 1993 | 65 |
| 1994 | 66 |
| 1995 | 60 |
| 1996 | 59 |
| 1997 | 49 |
| 1998 | 57 |
| 1999 | 51 |
| 2000 | 45 |
| 2001 | 38 |
| 2002 | 27 |
| 2003 | 40 |
| 2004 | 26 |
| 2005 | 31 |
| 2006 | 33 |
| 2007 | 22 |
| 2008 | 16 |
| 2009 | 11 |
| 2010 | 22 |
| 2011 | 12 |
| 2012 | 5 |
| 2013 | 8 |
| 2014 | 2 |
| 2015 | 6 |
Decreasing input of nutrients
Input of nitrogen and phosphorus to livestock farms (in the form of feeds) and to arable farming and horticulture (as fertilisers) has been reduced considerably over the past 25 years. Flows of nitrogen and phosphorus from agriculture itself (i.e. animal manure and roughage) as well as industrial input (mineral fertilisers and concentrates) have also decreased significantly. Despite reduced inputs of these minerals, outputs through agricultural products has remained at similar levels. The slight decrease in plant production was offset by a slight increase in animal production.

Related items
- Environmental Data Compendium - Manure surplus in agriculture
- Eurostat - Gross nitrogen balance
- Eurostat - Risk of pollution by phosphorus