female labour participation stabilising following years of increase

According to figures released by Statistics Netherlands today, participation of Dutch women on the labour market rose substantially in the period 1998-2013. At the end of 2013, however, it fell slightly, and in the first three quarters of 2014 it hardly changed at all. This development was mainly the result of more women leaving the labour market. Study and ill health are becoming increasingly common reasons for women not to want a paid job.
Labour participation of women up, but still lower than that of men
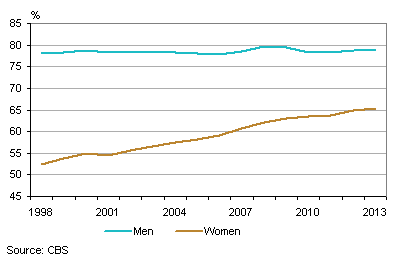
The gross labour participation rate for women was 65.4 percent in 2013. This means that nearly two-thirds of all women aged 15-64 years were active on the labour market, either working or looking for work. In 1998 this was still 52.5 percent. For men in the age group 15-64 years, labour participation hardly rose between 1998 and 2013. In 2013 it was 78.7 percent.
The number of working women has risen considerably since the end of the 1990s. In 2013, 733 thousand more women than in 1998 had a paid job of at least 12 hours a week. For every hundred employed men in 1998, there were nearly 66 employed women. By 2013 this had risen to 82 working women per hundred working men. The participation rate of women is thus still much lower than that of men.
Gross labour participation

Increase in labour participation of women levelling off in 2014
The economic crisis has had a slight effect on male labour participation. It fell from 79.4 percent at the beginning of 2008 to 78.3 percent in 2011, and subsequently remained fairly stable. Labour participation among women continued to rise in the crisis years, to 65.6 percent in the third quarter of 2013. The share of working women remained unchanged, however. Since then the participation rate for women has decreased slightly. It has been below 65 percent for three quarters now.
Gross labour participation, seasonally corrected quarterly figures

More women leaving the labour market
The slight fall in female labour participation since the end of 2013 is the result of more women leaving than entering the labour market. In the fourth quarter, in particular, relatively many women no longer had a job or were no longer looking for one. In the subsequent six months, too, the number of women entering the labour force did not exceed the number leaving. As school-leavers enter the labour market in the third quarter, there is usually a net inflow in that quarter.
Inflow and outflow of women in the labour force

More women not working because of study or ill health
Just over eight in ten women who were not active in the labour force in the third quarter of 2014 did not want to work. Most of them reported education as the main reason for this. The increase in the number of non-active women since the fourth quarter of 2013 is also partly because more women are in or intend to enrol in education. This number had decreased in previous years. There was a notable rise in the number of women reporting they did not want to work as a result of illness or disability. This may be related to the decrease in the number of women who do not want to work because they have retired or think they are too old to work. In both cases this is mainly reported by women aged 55 and older.
Women aged 15-64 years, by reason for not wanting a paid job

Most working women work part-time
Not only do fewer women work than men, they also work fewer hours. Women in the employed labour force worked for an average 28.5 hours a week in 2013, compared with nearly 39 hours for men. The main reason for this is that the large majority of women work part-time. Eight in ten men worked more than 35 hours a week, compared with just under three in ten women. Men also did more overtime: 36 percent of working men, versus 28 percent of working women.
Employed labour force by working hours and overtime, 2013
