Burden of income tax and social security contributions remains stable

In 2013 the gross income of Dutch households averaged nearly 58 thousand euros. The tax authorities received 6.0 thousand euros in income tax from this amount and 5.4 thousand euros in social security contributions, in total 19.7 percent. This share has hardly changed in recent years according to the publication by Statistics Netherlands ‘Welvaart in Nederland 2014’. The higher incomes contribute substantially more than the lower incomes.
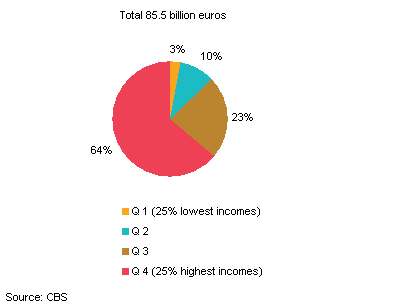
The highest incomes pay 64 percent, the lowest incomes 3 percent
In 2013 some 54.6 billion euros or 64 percent of the total amount of income tax and social security contributions was paid by the 25% group of households with the highest incomes. The 25% group of households with the lowest incomes contributed 2.6 billion or 3 percent of the total amount of income tax and social security contributions.
Share of income tax and social security contributions by income group, 2013*

Burden on the highest incomes three times greater than on the lowest incomes
The gross income of the households in the 25% group with the highest incomes averaged over 120 thousand euros in 2013. They had to pay nearly 25 percent in income tax and social security contributions . The burden was substantially lower on the households in the 25% group with the lowest incomes: they paid 8.5 percent of their gross income, which averaged barely 17 thousand euros.
Average burden on gross income by income group (with an average gross income), 2013*

Lower burden for retired people
The lower incomes pay far less income tax and social security contributions than the higher incomes. This is of course mainly related to their income level. Moreover, relatively many households in the lower income groups live on benefits or a pension. People receiving an AOW old age pension pay a lot less in social insurance premiums, as they no longer pay the premium for an AOW pension. Therefore the burden for retired people in 2013 averaged slightly over 15 percent of their gross income.
Average burden by source of household income (with an average gross income), 2013*

Barely a change in burden in recent years
At the start of the century the burden of income tax and social security contributions on gross income decreased slightly. In 2008 and 2009 the burden increased again, remaining virtually the same until the end of 2013.
In the period 2001-2006 there was a relatively great easing of the burden for the two lowest income groups. This was one of the consequences of making more health care cost tax deductible as extra expenditure. This meant that the lowest income groups saw their taxable income fall relatively sharply so that they had to pay less income tax. In 2009 this tax deductible option was curtailed, which led to a higher tax payments. So the burden increased sharply in 2009 but it has remained virtually unchanged ever since.
Average burden of income tax and social security contributions per income group
