Dutch use less water

Consumption of tap water in the Netherlands fell slightly between 2003 and 2006. Although the population increased, water consumption did not. Industrial tap water consumption fell by 2 percent less per year in this period. Industrial extraction of groundwater has also been decreasing since 2003.
Companies use 2 percent less water yearly
Industrial use of water fell by just over 2 percent per year in the period 2003-2006. The largest decrease was in agriculture. The fall in industrial tap water consumption pushed down overall tap water consumption by nearly 1 percent per year in this period.
Tap water consumption and population growth

Population increasing, but hardly using more water
Compared with 1990, total household consumption of tap water has hardly increased. Although the population has grown, consumption per person has fallen substantially. In 1990 the average consumption was 47.9 cubic metres per person. In 2006 this had fallen to 44.7 cubic metres. This is a decrease of 7 percent in the space of 16 years. Households account for two-thirds of tap water consumption. Industrial use has fallen by an average 1.3 percent per year since 1990.
Groundwater use

Industry uses less and less groundwater
Total extraction of groundwater fell by 6 percent in the period 2003-2006. Together, the sectors manufacturing, energy companies, and environmental services extracted 13 percent less groundwater, agriculture used 14 percent less. Agricultural use of groundwater correlates strongly with the weather. If the weather is dry during the growing season, as it was in 2003 and 2006, farmers need to use more groundwater than in a season with normal weather.
Water companies extracted 3 percent less groundwater from 2003 to 2006; they account for three-quarters of the total amount of groundwater extracted.
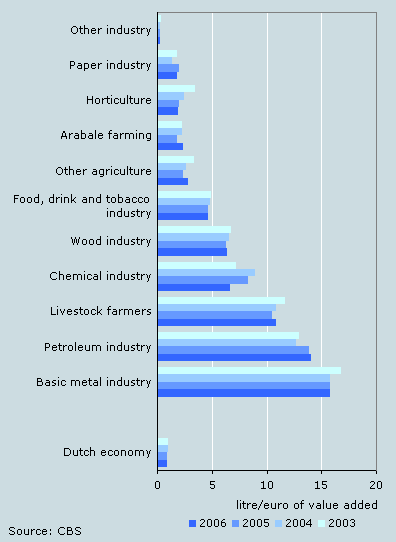
Tap water consumption per euro of value added

Dutch economy needs less and less water
The Dutch economy uses about one 1 litre of water for every euro it earns. In recent years, less and less water has been used per euro of value added. In 2003, for example, the economy needed 1.04 litres, while in 2006 this had fallen to 0.89 of a litre per euro. The basic metal industry and petroleum industry use most tap water per euro, followed by livestock farmers, the chemical industry and the wood industry. Tap water use per euro earned has fallen in most sectors of industry.
Cor Graveland and Kees Baas