Dutch pension provisions highest in Europe

Dutch households have built up substantial pension provisions with pension funds and life insurance companies. At the end of 2006 these institutions managed a total 941 billion euro in pensions. This is nearly 1.8 times the value of the gross domestic product (GDP). In relative terms, Dutch provisions are the highest of all EU countries. Denmark is a good second, while eastern European countries lag far behind.
Three pillars of pension provisions in the Netherlands
The Dutch pensions system is structured on the basis of three pillars: national old age pension (AOW), collective labour-related pension schemes, and individual pension schemes. The collective and individual schemes are arrangements with banks and insurance companies. At the end of 2006, the amount managed by these institutions was two and a half times as high as in 1995. The value of collective pension funds in particular has risen.
Pension provisions in the Netherlands

Leaders in Europe
There are two way to finance pensions. In the Netherlands the fist pillar is based on a pay-as-you-go system, the second and third pillars are backed by funded assets. With the well-stocked provisions in the second and third pillars (176 percent of GDP), the Netherlands has an exceptional position in Europe. In Denmark these provisions correspond with 102 percent of GDP. In Sweden and France the amount is equal to about two-thirds of GDP. The average in Europe is about 55 percent of GDP.
Rumania, Latvia and Lithuania lag far behind
Pension provisions in Latvia, Lithuania and Rumania amount to no more than 2 percent of GDP. In countries with low pension provisions pensions are mainly paid from the received pension contributions of people still working. In addition, pensioners can supplement their pension with savings and income from other capital assets such as real estate.
Pension provisions, 2005

Provisions in the Netherlands also rose by most
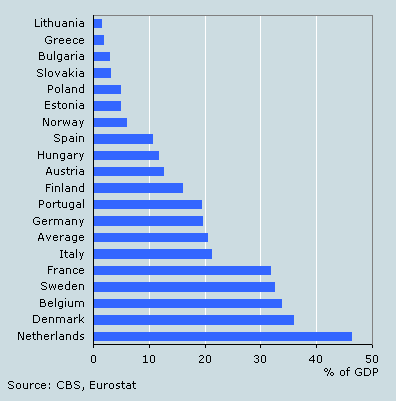
The amounts held in collective and individual pension provisions rose in all countries in the period 1995–2005. They rose by most in the Netherlands: from 126 to 172 percent of GDP. In Denmark, Belgium, Sweden and France, too, provisions rose by more than average.
Changes in pension provisions, 1995–2005

Jan Ramaker