Mild weather reduces consumption growth

A big drop in the consumption of natural gas has curbed household spending since the fourth quarter of 2006. In the first and second quarter of 2007 households spent approximately 1.5 percent more on goods and services than twelve months previously. The average growth in 2006 was almost twice as high.
Drop in gas consumption
The growth rate of household consumption has dropped considerably. Due to the mild weather conditions households have used far less natural gas for heating in the last quarter of 2006 and in the two quarters of 2007 than in the same periods twelve months previously. When natural gas consumption is not taken into account, the effect on household spending becomes quite clear. In that case, consumption is up by 2.7 percent in the first quarter of 2007 instead of 1.4 percent.
Not only was the weather extremely mild in first quarter of 2007, it had been slightly colder than on average in the first quarter of 2006. Gas consumption excluded, consumption growth in the fourth quarter of 2006 and the second quarter of 2007 was 0.4 of a percentage point higher. This means that gas consumption excluded, the growth rate almost equalled the strong increase in 2006.
Household consumption
Final invoice of the gas supplier
In statistics on consumer spending, the expenditure on natural gas is counted in the month the household actually used the gas. The effect on total consumption growth is strongest in months when most heating is necessary.
The amount saved on natural gas is not directly refunded to the consumer, but deducted from the final instalment payable at the end of the year. Households have to reckon with a large price increase however, as natural gas was about 10 percent more expensive in the first six months of 2007 than a year previously.
Expenditure on durable consumer goods still booming
Compared with the first and second quarter of 2006, households spent over 5 percent more on durable consumer goods. The average growth rate of 6 percent in 2006 was exuberant as well. The growth rate then was the record high since the beginning of the century. Examples of durable consumer goods are clothing, shoes, furniture, washing machines, television sets, computers and cars. Spending on these goods are susceptible to economic fluctuations.
Household consumption by category

Consumption expenditure on food, beverages and tobacco was up by 1.7 percent on the first and second quarter in 2006. This is almost 0.5 of a percentage point less than the 2006 average. Spending on services also grew somewhat less than the 2006 average. Households spent more on transport and communication and in hotels and restaurants in particular. Changes in way the child care is financed came into effect on 1 January 2007. This had a downward effect of approximately 0.5 of a percentage point on household spending on services in 2007. The downward effect on total consumption expenditure is 0.25 of a percentage point.
The decrease in household consumption of other goods is entirely due to the sharp drop in natural gas consumption. Besides natural gas, newspapers, books, detergents, cosmetics, fuels and flowers are seen as ‘other goods’ as well.
Big shift in spending pattern
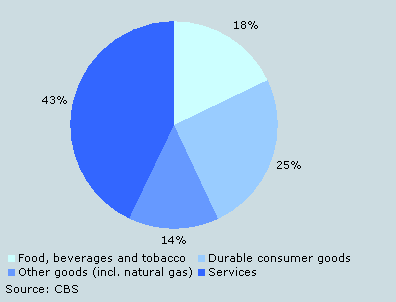
In 2006, the value of domestic household spending added up to almost 253 billion euros. Spending on services amounted to 133 billion, consisting mainly of housing. In addition, 49 billion euro was spent on durable consumer goods, and 35 billion on food, including beverages and tobacco. Household expenditure on other goods also added up to 35 billion euros.
Share in domestic household consumption, 2006

The share of services in domestic household consumption increased considerably in the past decades. In 1987, 43 percent of domestic consumption was accounted for by services. Among those are housing, insurance, dining in restaurants and travelling by bus or train. This ratio has changed drastically. Twenty years later, services have a 53 percent share in domestic household consumption. Households have become frequent users of new services as mobile phones and the internet. In 2006, they spent 11 billion on communication services, compared to less than 2 billion in 1987.
Share in domestic household consumption, 1987

Consumption growth lags behind economic growth
Household consumption has been growing less than the economy as a whole for about 16 quarters in a row. Of the other components the growth rate of exports clearly exceeded that of the economic growth.
Consumption growth and economic growth

The years 2003, 2004 and 2005 were lean years for households. Real disposable income fell in 2003 and 2005, and only 2004 showed a small increase. The situation on the labour market was gloomy as well, with unemployment rising and job numbers falling.
Then there was a recovery in 2006. Unemployment fell and the number of jobs for employees rose. For the first time in years, households had substantially more to spend. These improvements went hand in hand with a strong rise in consumer confidence and a recovery of consumer spending. In the first six months of 2007, consumer confidence was still high. The situation on the labour market also remained favourable. Spending on natural gas excluded, consumption expenditure maintained a robust growth.
