High number of havo students facing delays

One in twenty students in secondary education faced delays in 2004. At the havo this was as much as one in ten. Pupils from non-western backgrounds faced a delay more often than other students did.
Many havo students face delays
In the change from school year 2003/’04 to 2004/’05 5 percent of secondary school students failed to move up, or changed to a lower level school type. At the havo leve,l some 10 percent of the students faced a delay, and at the vwo level it was 6 percent.
The share of students facing delays was smallest in years 1 and 2 of secondary education. During those years students have not yet made a choice in school type. Therefore the delay is only caused by failing to move up.
Delayed students by school type, 2004

Non-western students face most delays
On average 6.7 percent of the students with a non-western background faced delays in 2004, versus 4.7 percent of native Dutch students. There are very small differences between the various background origins. Students from Antillean and Aruban backgrounds faced fewer delays than the average for non-western students (5.9 percent). Turkish students (6.7 percent) and students with an other non-western background faced slightly more delayss (7.2 percent).
Turkish students face most delays
Students from a Turkish background face most delays, in vmbo, havo and vwo. Students with a Surinamese background also faced above average delays in vmbo, havo and vwo. However, they did not duplicate the first two years as often as students with other non-western backgrounds. As of their third year the delays are no longer as striking.
Delayed students by background, 2004

Schools in smaller municipalities perform better
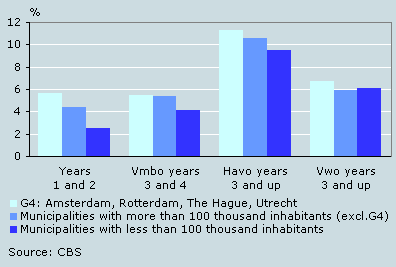
Schools in smaller municipalities had fewer delays than schools in larger municipalities in 2004. This applied to native and non-western students. The greatest difference shows up during the first two years of secondary education.
Delayed students by school municipality, 2004

Marijke Hartgers