Energy use up

In 2003 energy use in the Netherlands amounted to 3,225 petajoules, the equivalent of 102 billion m3 of natural gas, a 2.5 percent rise on 2002.
Energy use in the Netherlands

Use in manufacturing industry significantly higher
The manufacturing industry accounted for two-thirds of the total increase in Dutch energy use. The petrochemical industry and refineries produced more, and power stations also noticeably contributed to the increase. Energy use by households rose slightly. Traffic used less energy.
Production of renewable energy

Renewable energy stable
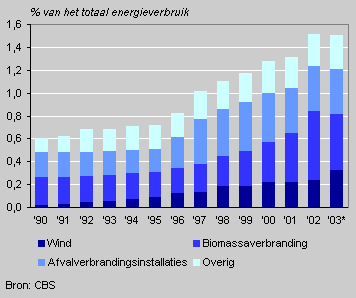
Domestic renewable energy sources accounted for 1.5 percent of the total energy use. Their contribution levelled off for the first time after a strong increase in previous years. This was caused by a substantial decrease in the combustion of biomass. Wind energy, on the other hand, rose substantially (by about 40 percent) because recently a large number of wind turbines have been erected.
Energy use per capita

Energy use per capita
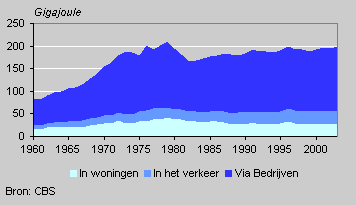
The number of inhabitants as well as energy use per capita rose. Energy use per capita has slightly increased since 1984. The highest energy use per capita, however, was realised in 1979 before the second oil crisis.
Natural gas and electricity are the main sources of energy for households. Household consumption of natural gas fell slightly because more houses were insulated. Household electricity consumption per capita continues to rise due to more electrical equipment.
Energy use per capita, EU 25

Energy use per capita, compared to other EU countries
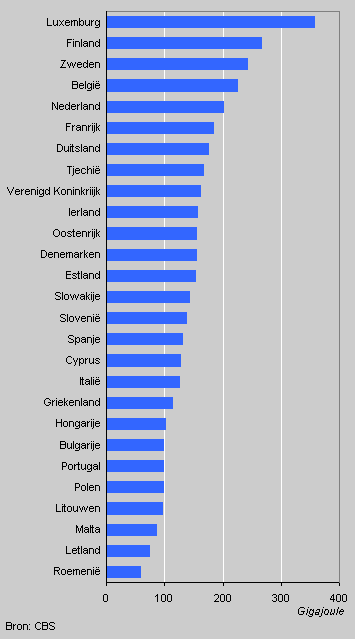
Energy use per capita in the European Union differs widely, due to climatic variation and industrialisation. Dutch energy use per capita is above the EU average.
Wouter Tinbergen
Source: Statline