CO2 emission stable in 2002

The emission of the greenhouse gas CO2 was about the same in 2002 as in 2001. Since 1990 it has increased steadily (+ 13 percent).
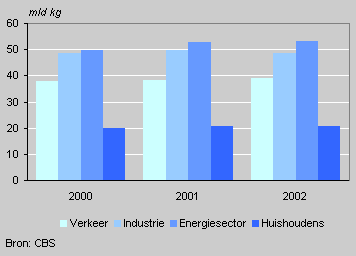
CO2 emission by activity

Opposite developments
The stability of the CO2 emission in the period 2001-2002 is the result of opposite trends: on the one hand the increase in emission by traffic (2 percent), the energy sector (1 percent), construction (10 percent) and waste processing (8 percent), and on the other decreases in manufacturing (including refineries) by 2 percent and households (1 percent). The decrease in refineries was the result of maintenance work in there. In addition, 2002 was a relatively warm year, requiring less fuel.
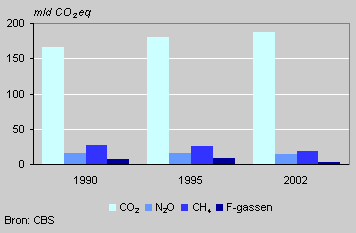
Emission of greenhouse gases

Lower emissions for other greenhouse gases
Opposite the increased emission of CO2, emissions of other greenhouse gases were lower. The emission of methane for example has fallen by 32 percent since 1990 and the emission of laughing gas (N2O) and chlorofluorocarbons by 7 and 55 percent respectively.
IPCC-figure
The amounts of greenhouse gases emitted are the basis for calculation according to the methodology of the Intergovernmental Panel of Climate Change (IPCC). The CO2 figure according to this method differs from the figures mentioned above. The increase since 1990 arrives at 10 percent. The emission of greenhouse gases , expressed in CO2 equivalents, has increased by 1 percent since 1990.
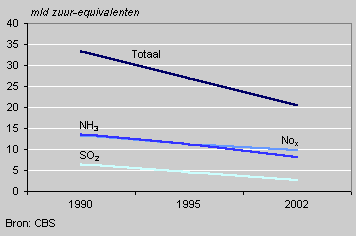
Emission of acidifying substances

Fewer acidifying and other substances
The emission of acidifying substances was substantially lower in 2002 than in 1990. The total environmental burden of acidifying substances was 39 percent lower.
The emission of carbon monoxide (CO) was 42 percent lower in 2002 than in 1990. The emission of volatile organic compounds (excluding methane) fell by 50 percent in the same period, that of small particulates by 42 percent.
Ed Zonneveld