Substantial increase in purchasing power of employees in 2000

The purchasing power of the Dutch population rose by 2.0 percent in 2000, a relatively strong increase. In the previous nine years it only rose by more - namely 2.8 percent - in 1998. The disposable income of households was 24,700 euro on average in 2000.
Employees in particular better off
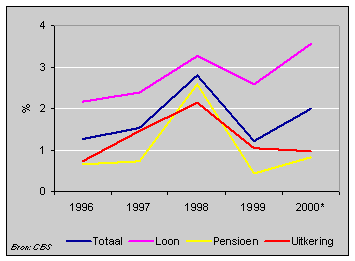
The improvement in purchasing power was greatest for employees. In 2000 households whose main source of income was an employee wage 3.6 percent more to spend than twelve months previously. This was the largest increase in purchasing power in five years.
For households with a benefit purchasing power rose by 1.0 percent. The improvement in the purchasing power of pensioners was 0.8 percent. This is about the same as in the last four years with the exception of 1998 when pensioners benefited from the extra tax deduction for the elderly.
Purchasing power by source of income, 1996-2000

Large differences
The 2.0 percent increase in purchasing power is the median of all increases and decreases in purchasing power. This means that for half of the population the increase was more than 2.0 percent on the previous year. For the other half it rose by less or even decreased.
Distribution of purchasing power changes, 2000

The differences between individual changes in purchasing power were considerable. The purchasing power of 36 percent of the population declined, for one quarter it rose by more than ten percent. Significant changes in purchasing power are often connected with changes in household composition or a change in the source of income. Divorce, retirement and reduced working hours, for example, all usually lead to a sharp drop in purchasing power.
Hans de Kleijn